After the fall, what now?
So after yesterday's big market correction, what can we expect now? Treasury yields may hold some important clues.
An honest assessment...
Regular readers will no doubt have realised that I am not a glass-half-full type of person. My glass has a nasty chip on the rim and a dead spider floating about in a dribble of fetid water at the bottom. I look at the world through a prism of gloom.
So what I am about to tell you might come as a surprise. After yesterday's piece about an imminent market correction, of which I am very proud, I am doubtful that this turns into a more lasting and sizeable fall. Believe me, I would love it to be. Personal wealth considerations aside, there's little I like more than a full-blown financial crash to make this job interesting. But I fear we may have to wait a little while longer. Why?
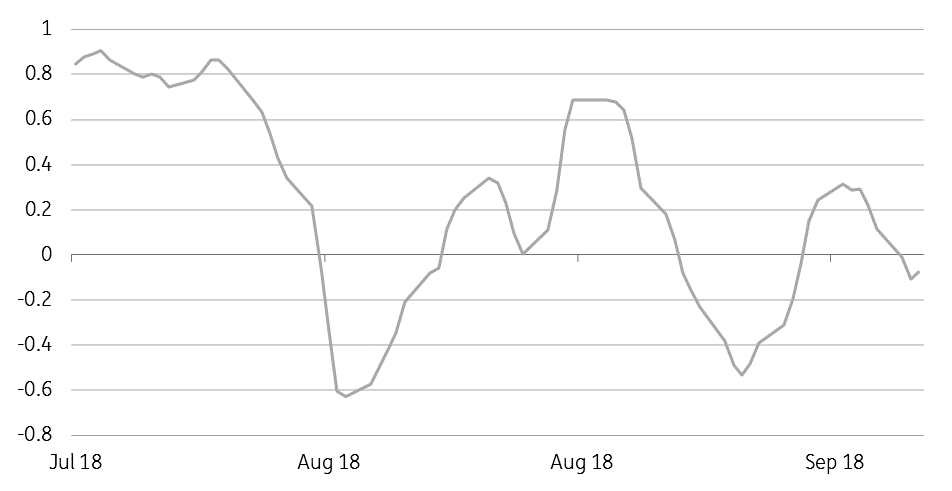
It's a simple matter of what the bond market is doing. Yesterday's stock market falls in the US were pronounced, but the fall in 10Y yields, about 7bp, was also enough to make the correlation chart we showed you yesterday, start to head back towards zero. Take a close look at this chart. When it starts to move in one direction, it tends to keep going.
So in all likelihood, this was a minor tremor. Not the big one. We'll keep watching the index, which seems well calibrated, but today may show the usual aftermath of bond rises, equities fall, bond yields fall, equities rise that we have seen in all such market gyrations this year.
10 day change in S&P price, 10Y US Treasury yield, 20-day rolling correlation

Consider calendar effects
Although we might not be quite there in terms of a big correction, we may not be too far off either. There is an interesting story today on Bloomberg Daybreak about US earnings guidance falling short of analysts estimates, and another version of my correlation chart (NB I was not cited) that suggests market sentiment is turning.
But take a step back from finance and economics for a minute, to consider human behaviour instead - then aggregate it. Suppose you were a US equity fund manager. If so, you likely started the year on a big high, but have spent much of the year trying to recover lost ground from the February correction. From February onwards, your main ambition was probably to finish the year up. Along the route, there were frequent dips, all viewed as buying opportunities, with the usual accompanying bond yield falls to help valuations support a recovery.
It took until late August to regain the January highs, and then claw further gains to reach the early October peak. But at this point on, with barely two and a half months of the year left to go, isn't the main goal to avoid ending the year under, not necessarily to finish ahead?
In short, we may not be on the verge of a precipitous drop, but it is probably optimistic to believe this will be a V-shaped bounce. Moreover, the market is clearly highly sensitive to a negative valuation shock, for example, an unexpectedly high inflation (though data due today likely to show inflation peaking) or (more likely) wages print before the year-end, encouraging thoughts of faster Fed tightening.
And what of the USD?
Asian currencies are by and large weathering this market shock quite well, and the USD is weak against all the majors too. If the world were in full panic mode, and about to sell further, then I doubt this would be the case.
We also have to bear in mind that the US President's latest Twitter intervention on the Fed is most likely also causing a little USD weakness too. So we aren't going to get over-excited about what is going on here based on the USD.
There may be a little further weakness. But give it a day or two, and we may be back to considering fundamentals. Just don't relax too much.
Asia Day ahead
Tomorrow morning, at 08:00 local time, we will get the Monetary Authority of Singapore's policy announcement and advance estimate of 3Q18 GDP. It’s not all bad for the economy, as I wrote in a longer note yesterday. But there are still many good reasons why the MAS will likely deliver no additional steepening of the SGD-NEER path or change to exchange rate bandwidth or central point. Not least of which will be the 3Q18 GDP result itself, which will likely show a sharp slowdown in year on year terms.
Watch out also for China's money supply data for September, which could come out today (or not) - New yuan loans should have picked up in response to the negative impacts of the trade-war on growth.
(And from Prakash Sakpal...) Malaysia's industrial production for August is due today. Dismal August export performance underpins our forecast of IP growth slowdown to 1.6% YoY from 2.6% in July. The MYR’s gain yesterday after a week-long selloff isn’t out of sync with gains in other ASEAN currencies, while local stocks slumped the most in four months. The clawback of the recent MYR underperformance relative to the oil price hinges on the trajectory Malaysia’s exports and GDP growth take going forward. However, the activity data doesn’t bode well here.
This publication has been prepared by ING solely for information purposes irrespective of a particular user's means, financial situation or investment objectives. The information does not constitute investment recommendation, and nor is it investment, legal or tax advice or an offer or solicitation to purchase or sell any financial instrument. Read more
Download
Download opinion
11 October 2018
Good MornING Asia - 11 October 2018 This bundle contains 4 Articles