Prepare for another huge fall in Japanese GDP
A fall of about 20% (annualised) in second-quarter Japanese GDP is not a big event these days - but for what it is worth, this is how we arrive at our forecasts
Private consumption down 19%
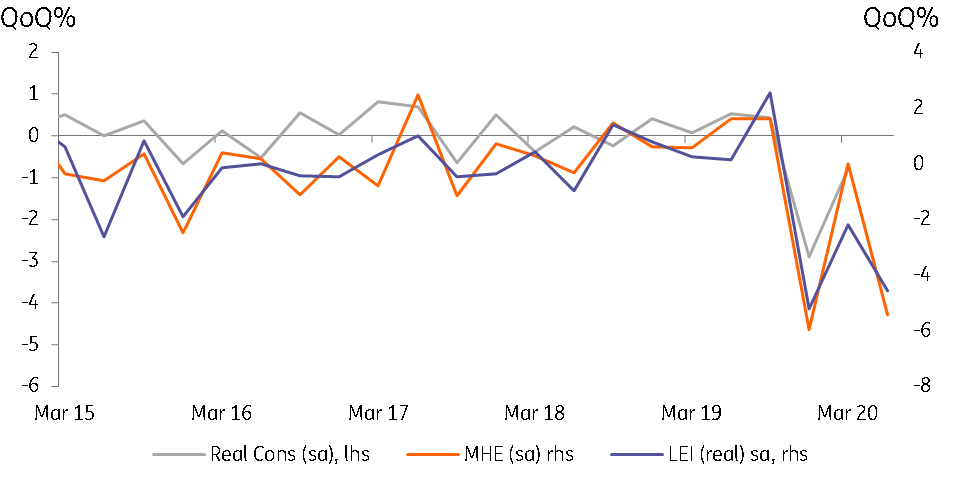
At 56% of real GDP, private consumer spending is the biggest component of the GDP forecast, so if we get this wrong, it will colour the entire forecast. So we take two approaches to this. Firstly, we seasonally adjust the monthly household expenditure (MHE) data, which is a nominal series, so we also ought to deflate this (though with inflation so low currently, it's not essential). As an audit on this approach, we also take the real living expenditure (LEI) survey data, which is already adjusted for prices and seasonal adjustment.
Both indices point to strong contractions, which equate to about a 5% QoQ decline in private consumer spending, or about a 19% decline at a seasonally adjusted annualised rate (SAAR).
Private consumer spending forecast

Investment
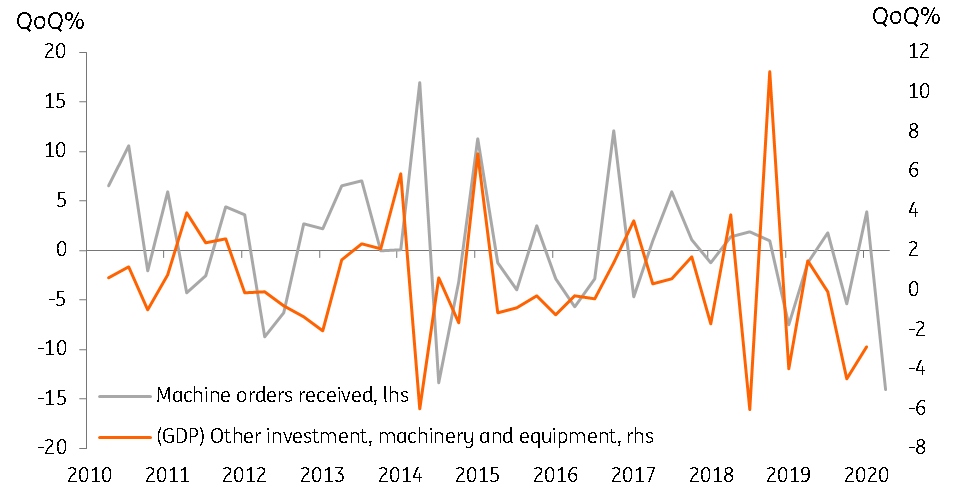
Private business investment in plant and machinery is another sizeable component of GDP (about 15.6% of the total), but more volatile than consumer spending. So while consumption is bigger, you are more likely to get investment wrong. There are a number of higher frequency economic series we can look at to help us judge how this will work out, but the machinery orders series is a good place to start. All such indices point to sharp declines in business investment of a little under 6% QoQ, or about a 21% fall (SAAR).
Business investment

Residential investment
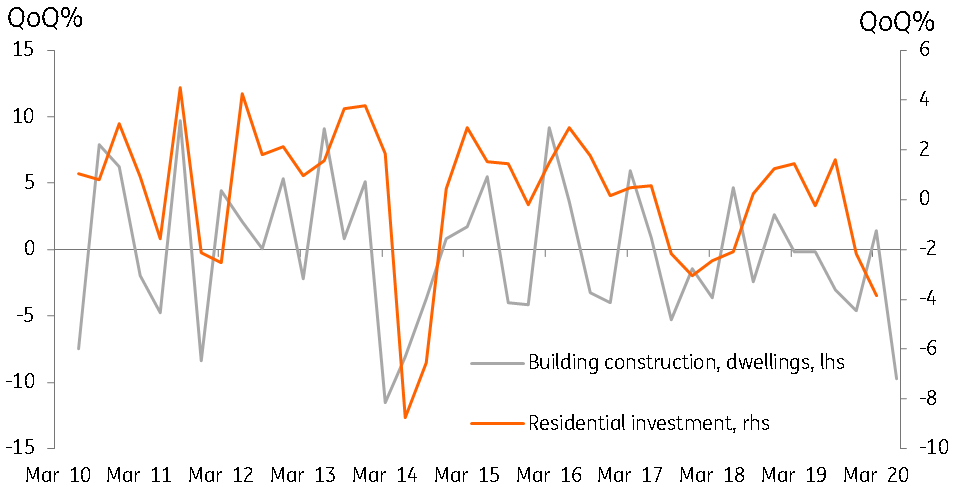
Residential investment accounts for less than 3% of total real GDP, so we don't need to be too careful about this, although it is also volatile, and scope for error is large. From monthly construction data on dwellings, it appears that private residential investment will decline by about 7.5% QoQ in 2Q20.
Another component of investment is government investment. This is typically captured by series on the construction of non-residential buildings and structures (roads, bridges, schools, hospitals etc). At about 5% of GDP, it is a bit larger than residential construction, but it is also hard to find consistent data proxies. Our data suggests about a 5.8%QoQ increase, reflecting the government's stimulus measures, and is one of the few positive contributions to private domestic demand this quarter. But this is not a high conviction part of the forecast and this could well contribute significantly to any overall forecasting error.
Private residential investment

Trade
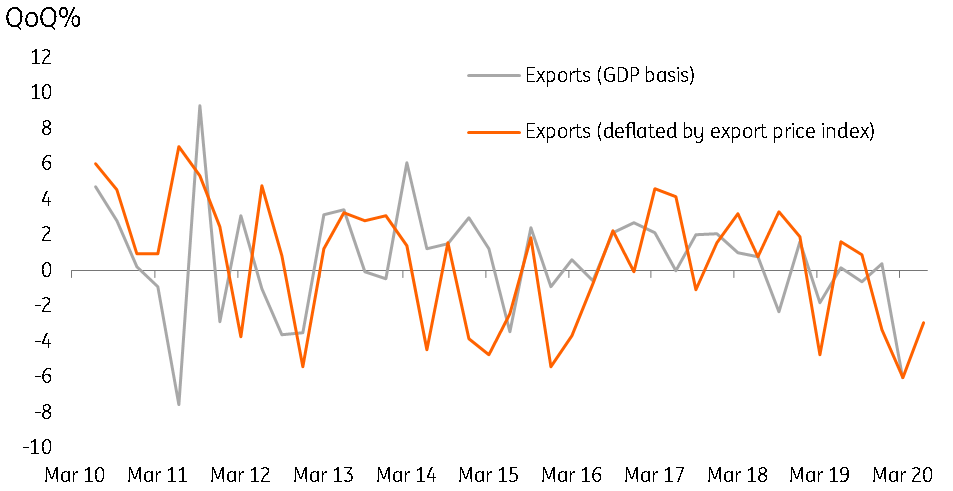
Net trade could be a substantial drag on GDP in 2Q20. But exactly how much remains an open question. Quarterly nominal export growth fell by about 6%QoQ in the second quarter. The equivalent figure for imports actually rose by 2%. But those figures have to be deflated for export and import price changes, and this series was very volatile in 2Q20, with export prices falling 3% (increasing the real decline in exports), while if we can believe the data, import prices fell by more than 12% over the quarter (increasing the rise in real imports).
For all the number crunching, the correlation between price adjusted trade data and the GDP series is not very good, so we have applied a liberal dose of "wet finger" to this part of the forecast, and again, the scope for error is large.
Loosely tied to the net trade figures is private inventory adjustment. Together with trade, this component can deliver a big shock to forecasters, as it is often the repository for whatever the official statisticians could not find a home for in other components. GDP negative import surges in the trade data, such as we have here, are often accompanied by big (GDP positive) surges in inventories. Monthly inventory data is of almost no help in gauging the extent of this, and we are left making an educated guess about the extent of the import surge in 2Q that simply accrued to inventories. Our best guess is that the net effect of this is to roughly halve the drag that would have occurred from net trade.
Exports

Putting it all together, about -20% (SAAR) seems right
When you throw all of the various constituent parts of this GDP forecast into a spreadsheet and add them all up, what drops out is a QoQ decline of a little under 5%, which delivers an annualised decline in the region of 20%.
We would not be surprised to see the number come in considerably different to this, though this is also not far from the consensus view (about a 25% decline). In terms of the risk to this forecast, it probably lies in a slightly less awful (less negative) figure, and will probably come through surprises in the net trade and inventory contributions. Nevertheless, it is difficult to see the market reading in anything particular positive into an annualised GDP decline of close to 20%, even if it comes in below consensus, so the market response, in that case, might be quite muted.
This publication has been prepared by ING solely for information purposes irrespective of a particular user's means, financial situation or investment objectives. The information does not constitute investment recommendation, and nor is it investment, legal or tax advice or an offer or solicitation to purchase or sell any financial instrument. Read more
Download
Download opinion
14 August 2020
Covid-19, Asia’s lamentable green response, and a slow, slow recovery This bundle contains 8 Articles