What credit spreads are pricing in is not realistic
Spreads currently price in the lower end of our expected default rates. In the midst of substantial recent tightening, we feel that current pricing is not realistic with respect to the expected volume of downgrades and our economic outlook. S&P and Moody’s have updated their default rate forecasts


Moody’s forecast is slightly lower than its previous expectations and is now at just below 10%, and S&P’s trailing 12-month forecast is marginally up now at 8.5%. However, our default rate forecast for the coming 12-15 months is unchanged and remains at the higher end.
To be able to plot our expectations and frame them properly we need to hold these up to rating agency expectations in terms of default rates, thankfully both S&P and Moody’s have updated their forecasts just recently.
Moody’s
Moody’s updated its forecast on 10 June for the global speculative-grade default rate and now expects that it will peak below 10%, slightly lower than projected previously. The rating agency’s projection incorporates an improvement in financial conditions resulting from significant policy stimulus and a notable recovery in market sentiment.
· Moody’s acknowledges that there is a significant uncertainty in the default rate outlook and that the baseline default forecast assumes there will be a big economic hit in the second quarter of this year, followed by a slow recovery in the second half of 2020. This does not assume a resurgence of the pandemic and that would require the widespread re-introduction of the lockdowns.
· Under the pessimistic scenario, defaults would rise dramatically to 16.3%, surpassing the September 2009 peak of 13.3%. The pessimistic scenario assumes a prolonged reduction in consumer spending, leading to greater economic drag vs the baseline scenario.
· Conversely, the optimistic scenario assumes global default rate reaching only 5.0% by May 2021. This envisages a stronger and faster economic recovery than the base-case scenario (akin to a V-shape trajectory).
In terms of regions, under Moody’s baseline scenario, the 12-month speculative-grade default rate is forecast to peak at 12.4% in February 2021 in the US (and reach 11.6% in May next year) and in Europe, the peak rate is forecast at 6.4% in March 2021 and reach 6.2% by May next year.
S&P
On 8 June, S&P provided an update for its default outlook for the European high yield universe. The rating agency increased its expected rates and now expects the European speculative-grade trailing 12-month high yield default rate to reach 8.5% in March 2021, up from 2.4% on the same trailing basis in March of this year (and 2.7% at the end of April).
This is equivalent to 62 high yield companies defaulting during the 12-month period of March 2020-March 2021. To put things in perspective, European speculative grade default rates have averaged around 2% without major fluctuations during a fairly lengthy recent period starting in 2011 (but still below the historical average of 3.1% calculated since January 2002). S&P’s new forecast is slightly above the 8.0% rate it forecast back in March and the update is driven by the lower economic forecasts for Europe by the rating agency’s economists since then.
The 12 months to April 2020 have delivered the highest level of credit deterioration since the peak of the global financial crisis fallout in 4Q09, when European speculative-grade default levels reached the high point of 10% in November of that year.
· Under S&P’s “optimistic scenario”, defaults will reach 3.5% by March 2021 (equivalent to 25 defaults) and under the “pessimistic scenario” the rating agency expects default rate to rise to 11.5% (84 defaults).
· The base case forecast is based around the underlying S&P central economic scenario, which envisages that two-thirds of economic losses will be recovered by 2021 but a return to a trend growth will only happen in 2023.
· The pessimistic scenario assumes a resurgence of the virus and an increase in the number of cases later this year or in early 2021 and/or a slower-than-anticipated recovery from the current economic slump. In this respect, S&P points out that the European economy is vulnerable to declining travel and tourism as well as to lower exports to the oil-producing countries, which account for a large portion of the region’s total exports.
· S&P points out that given the unprecedented situation and high future uncertainty, the “scenarios” could more appropriately be described as separate possible paths rather than a variation around the central case and that eventual defaults could move to a higher “plateau” as opposed to following the peak-to-trough pattern of the previous economic cycles.
Interestingly, the rating agency is also asking the same question we have been asking ourselves for the past couple of weeks of relentless tightening – is it possible that “bond investors are more optimistic than the underlying economy and financial markets suggest” and that risk is not adequately priced in here.
ING's view
We believe the truth might well lie in between the elevated levels of the Global Financial Crisis and the most "optimistic” scenario.
| 10% |
European speculative grade default rate |
This however, at least for the time being is not a systemic crisis but one that has already led to higher corporate leverage and pressure on speculative grade issuers. As such default rates might well hit 10% but the GFC peak at c.13% should be out of reach.
Our economists’ base case scenario for Eurozone GDP growth in 2020 has worsened slightly to -8%, from their initial forecast of -5%. On the other hand, the US GDP growth forecast is better with -5.3% under the base case, versus the initial -7%.
Looking back historically at default rate levels, the depth of the economic downturn and the accompanying spreads will give us some guidance where spreads could or should be trending from here. This is highlighted in Figure 1 and backed up by the theoretical compensation for these spreads on the basis of loss given default calculations assuming 40% recovery rates (i.e. how high should credit spreads be to compensate for certain cumulative or annual default rates).
Figure 1 Corporate high yield spreads

Thus spreads can be used as a theoretical basis for the calculation of the level of default rates and related to the duration of the particular index. We have decided to use the cash non-financial high yield index as the best current proxy (due to the speculative grade nature of default rates its best to frame this valuation through high yield markets). On the left-hand side we see the ASW level the index trades and the parallel lines show the commensurate cumulative default rates for the duration of that index.
Reading the graph; the index and the accompanying 1yr default rate that is being priced into spreads shows that we are looking at a scenario where default rates are not EVEN expected to approach levels seen during the early 2000’s recession (dot-com bubble) and nowhere near those seen during the global financial crisis some 10 years ago.
Looking at the right-hand side we see the comparison to historic default rates according to Moody’s data, and unsurprisingly we see additional risk premium as spreads factor in more possible downside in times of stress. However, we do not feel that current spreads are pricing in enough risk, and thus levels are unrealistic.
So what does this mean in terms of current pricing?
In terms of valuation, at around 464bp the High Yield Non-Financial index under Figure 1, the 1yr implied default rate at 7.6% computes to a 5yr default rate at some 33%. Looking at what is being priced into Investment grade indices taking the Investment grade Non-Financial index as the spread level of 115bp we use to compute implied default rates, we ascertain that 1yr implied default is priced at 2% and 5yr at no less than 9%, however, in investment grade financing routes through bond markets are well and truly open, assuring liquidity and business continuity according to our and rating agency expectations.
Looking back at what European High Yield markets are pricing into their synthetic indices identifies that the current iTraxx index and the Crossover index at 100bp and 407bp respectively, entails a 1yr implied default rate at 1.2% and 6.8% respectively. Similarly in the US, the CDX IG and CDX HY are pricing in spread levels of 71bp and 470bp respectively, which computes 1yr implied default rates of 1.2% and 6.6% respectively.
This crisis has one big difference in terms of financing compared to the GFC and dot com bubble, markets have not been closed. In fact, we have seen substantial investment grade corporate supply, already reaching €261bn YTD, versus €177bn YTD in 2019. Bond markets have been guaranteeing liquidity for many challenged issuers. Bank balance sheets too are stronger and will be able to absorb more, and let’s not forget government support measures (not just QE) is also dis-similar to the GFC and will also offer some bankruptcy protection. Hence as stated before we feel comfortable with default rates approaching 10% but not getting to GFC levels.
In conclusion, we do expect a rise in default rates, as poor earnings and liquidity issues and of course rating migrations add more default risk. Therefore, we expect default rates to rise to between 7% and 10%. We are seeing significant support across the investment grade space in both Euro and USD, from the ECB and Fed. Although European high yield is not supported as directly, corporates can still meet their refinancing needs albeit at high levels.
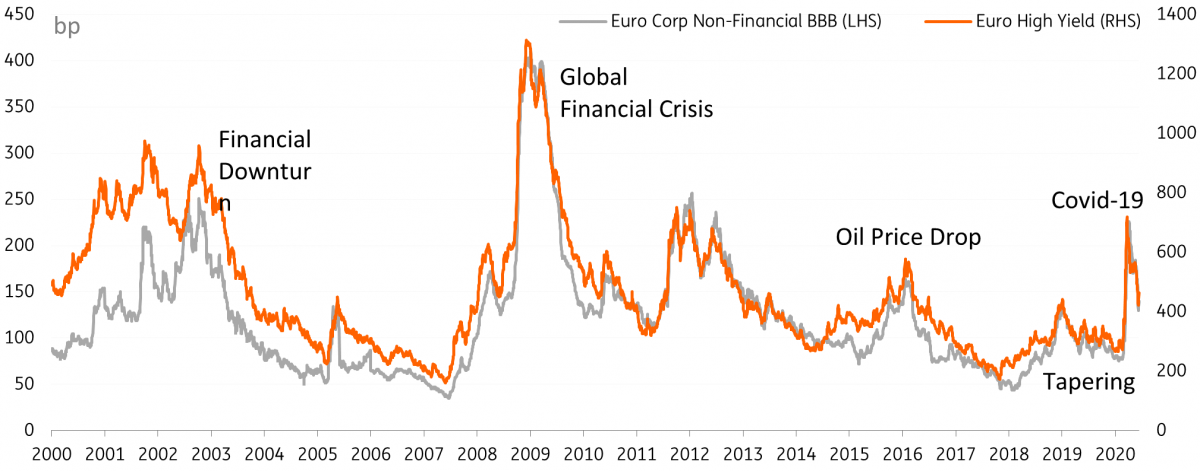
Figure 2 Major Events
This publication has been prepared by ING solely for information purposes irrespective of a particular user's means, financial situation or investment objectives. The information does not constitute investment recommendation, and nor is it investment, legal or tax advice or an offer or solicitation to purchase or sell any financial instrument. Read more
Download
Download article