US: Wealth surges even in a pandemic
US household net worth increased $12.6tn last year as unprecedented fiscal and monetary support first stabilised the economy before fuelling a recovery in risk appetite. While the rich are undoubtedly getting richer, there is evidence that less well-off households have seen some improvement, which will provide a strong platform for growth in 2021

Assets roar back
The Federal Reserve Flow of Funds data for 4Q20 shows some astonishing figures. Despite the pandemic and the resulting lockdowns, business closures and, at its worst point, the loss of more than 20 million jobs, the US household balance sheet improved massively through 2020.
Total assets jumped by $12.6tn – not quite as good as the $13.2tn gain in 2019, but remarkable given what was endured last year. Meanwhile, household liabilities increased by only $657bn to leave net worth up $11.9tn – a gain equivalent to 57% of 2020 GDP!
US household assets, liabilities and net worth
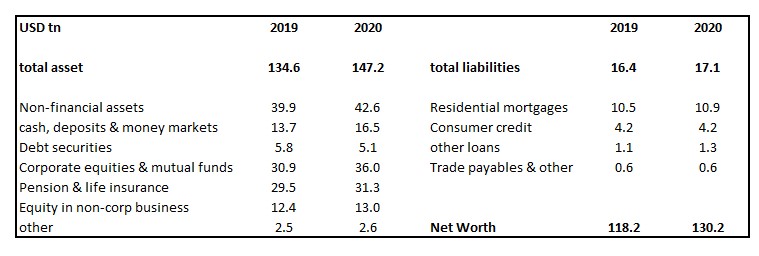
Unprecedented stimulus drives market gains
Looking at the quarterly profile the performance is even more remarkable. Households experienced a $6.7tn plunge in the value of their assets in 1Q in response to the economic pain and uncertainty created by the pandemic. However, it rebounded by $19.3tn between the start of 2Q20 and the end of the year to stand at $147.2tn or 664% of GDP. Real estate contributed “just” $1.86tn of this with financial assets making up the bulk of the gains by adding $17tn. The remainder came from equipment and other physical assets.
Corporate equities and mutual funds were the biggest contributor as households benefited from surging equity markets in the wake of unprecedented monetary and fiscal stimulus, while pension and insurance funds improved for the same reasons. However, we also see a notable increase in cash, checking and savings deposits – a gain equivalent to more than 10% of GDP!
Liabilities increased, but at a far more modest rate – up $583.6bn to $16.4tn. The stock of outstanding mortgage debt increased by $391.9bn to $10.9tn while consumer credit rose just $41.8bn to $4.178tn.
Quarterly change in the value of household financial assets 2017-2020 (USD tn)

The wealthy are getting wealthier, but…
The overwhelming majority of the increases in wealth is going to have been concentrated in higher income and already wealthy households. The obvious narrative is that higher income and wealthier households spend more on services and “experiences” such as travel, eating out, theatre, cinema – things that Covid containment measures have prevented. Consequently, we are likely to have seen a significant increase in unplanned saving with the money instead put into various financial and physical assets.
In any case, these households are likely to have more of their wealth in equities, pensions and real estate in the first place so will have benefited from surging stock and real estate prices in the wake of massive stimulus efforts from the Federal Reserve and Federal Government.
However, we think that there are interesting nuances that sets the US apart from elsewhere. We suspect that the way the US government reacted to the crisis has broadened out the range of households who have seen an improvement in their financial position. While not necessarily making a huge dent in the wealth inequality within the US, there is evidence of a tangible increase in net financial worth spread over more of the income spectrum. This could have a significant impact on path of the recovery.
US government policy boosted incomes of poorer households
The US and Europe took very different approaches in dealing with the pandemic’s effects on the jobs market. The European furlough schemes were designed to preserve jobs with the government subsidizing the private sector to keep workers on payrolls. This wasn’t a full subsidy as there were limits in terms of both percentage of salaries and caps for monthly payments so those on the schemes ended up with lower incomes.
The US government took the decision to avoid interfering directly in the labour market. Instead, they chose to strengthen the financial safety net for those who lost their jobs by extending the duration of unemployment benefits, expanding the number of people who could receive them and then initiating a new $600 weekly Federal unemployment benefit to boost incomes. In consequence, the University of Chicago calculated that 69% of unemployment benefit recipients actually earned more money being unemployed than when they were working. The median recipient received 134% of their previous after-tax compensation.
When combined with $1200 CARES Act stimulus payments and the fact that half the jobs lost during the pandemic have been recovered, we see that US incomes have increased substantially versus pre-pandemic levels. This has not been the case in Europe.
Annualised US household income changes versus February 2020 (USD tn)

Lower income households have improved their financial position
With opportunities for spending being limited due to Covid containment measures it is likely that not all of these income gains have been spent. Indeed, monthly data suggests outstanding credit card balances have been paid down and are currently at four-year lows. ING’s own survey of savings also suggests that there has been more saving right across the income spectrum, whereas in Europe higher savings has been a story seen mainly in higher income households.
US savings have increased across the income spectrum

Recent data has shown that the improved financial position of a broader range of US households means that when presented with a windfall payment, such as the latest $600 stimulus cheque, consumers have the confidence to spend it. This contributed to a 5% month-on-month jump in retail sales in January with daily credit and debit card transaction data from www.tracktherecovery.org indicating that the bulk of the additional spending came from lower income households.
Household spending on debit and credit cards since January 2020

A better platform for recovery
This is an encouraging precedent for the outlook for consumer spending. Another $1400 cheque is soon on its way and this too should boost consumer spending, particularly with the vaccine program going well and a broad re-opening anticipated as we progress through the second quarter. This means there will be a broader range of options to spend money on this time around.
We expect job opportunities to improve further – note that the NFIB small business survey suggest that 40% of small firms already have job openings they cannot fill – an all-time high. Consumer sentiment surveys already suggest that households expect jobs to become more plentiful and this should heighten the chances that households use some of their accrued savings for spending over coming months – especially with more options such as travel and leisure being made available.
Significantly, with the extended Federal unemployment benefits continuing as part of the $1.9tn stimulus, the unemployed also have the guarantee of robust financial support in addition to state benefits to fall back on should they fail to find work.
This should cement the US’ position as the fastest growing developed market economy and potentially allow it even grow as fast as China this year – ING are forecasting 6.5% GDP growth for the US in 2021 and 7% for China.
Huge wealth inequality persists
While we suggest there have been increases in wealth across the income spectrum in the US relative to Europe, that is not to say there has been a narrowing in wealth inequality. As another Federal Reserve survey from last year shows – Changes in U.S. Family Finances from 2016 to 2019 – there are huge divergences and those are still likely to have increased
That report shows that the median net worth (gross physical and financial assets less liabilities) of US households in 2019 was 121,700, but the wealthiest 10% of households had a median net worth of $2.6mn while for the poorest 25% of US households it was just $300. When looking at the mean the numbers are $5.7mn and a net debt of $13,500 respectively.
Much has been made of the gains in equity markets and the “democratization” provided by commission free trading apps, but the Fed’s survey of family finances shows just 15% of respondents directly owned stocks in 2019 while 9% had a pooled investment fund and 50% had a retirement account. Given what we have seen in the asset performance number – this reinforces the view that the wealthy continue to accelerate away from everyone else.
Family median and mean net worth

This publication has been prepared by ING solely for information purposes irrespective of a particular user's means, financial situation or investment objectives. The information does not constitute investment recommendation, and nor is it investment, legal or tax advice or an offer or solicitation to purchase or sell any financial instrument. Read more
Download
Download article
11 March 2021
Who wants to be a trillionaire? This bundle contains 6 Articles