US: Inflation – to the moon!
Alright, not to the moon, but US inflation surged higher in April, primarily on the back of higher used car prices. Troublingly, there is evidence of broadening price pressures too. We increasingly doubt the Fed’s position that this is transitory and think they will end up hiking rates far sooner than 2024

| 4.2% |
Annual inflation rate in the United States |
There’s no inflation… nothing to see here… oh…
We’ve been warning about the prospect of higher for longer inflation in the US for many months, but even we hadn’t predicted this. Headline inflation jumped 0.8% month-on-month versus the 0.2% consensus while the core (ex food and energy) component rose 0.9% versus the 0.3% forecast.
This is the highest headline MoM reading since September 2009 and the highest core reading since 1981. It leaves the annual rates of inflation at 4.2% and 3% respectively.
This is the highest headline MoM reading since September 2009 and the highest core reading since 1981.
The details show used car prices were the big surprise, jumping 10% MoM while new vehicles prices rose 0.5% – this potentially offers more evidence of the supply disruptions in the sector relating to semi-conductor chips that the auto makers have been very vocal about. At the same time, stimulus checks mean buyers have cash to burn so prices are getting bid up.
The economic reopening frictions are evident elsewhere with recreation prices up 0.9%, commodities up 1.1%, food up 0.4% and education and apparel both up 0.3% MoM.
Energy fell, but aside from that the only "benign" components were owners’ equivalent rent (but that will jump over 2H21 as a lagged response to surging property prices) and medical care. However, the latter is likely to pick up as elective procedures become more available.
CPI, PPI and import price inflation (YoY%)
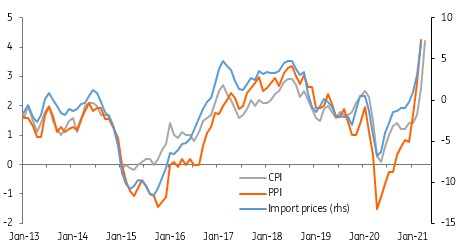
This isn’t the peak
Inflation is likely to head even higher over the next couple of months as price levels in a vibrant, strengthening economy that has supply constraints, contrast starkly with those of twelve months ago when the economy was in lockdown and prices were being slashed in order to generate cashflow. Just 0.2% MoM readings for May will leave headline CPI at 4.5% and core at 3.3% – the risks are most definitely to the upside.
Risks are most definitely to the upside.
Admittedly, the annual rates should start edging lower as we move through 3Q and the economic extreme of lockdown is no longer included in the calculation. Nonetheless, we are not as optimistic as the Federal Reserve in thinking this is purely “transitory” and we will quickly be back down to 2% and stay there.
Higher for longer
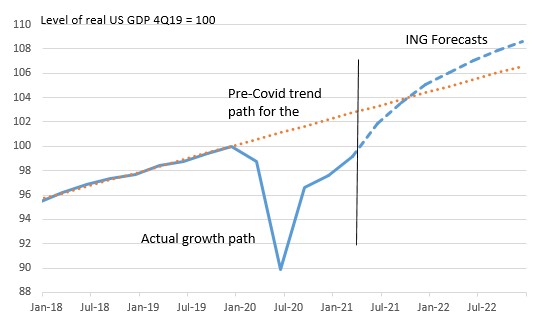
The key reason is that the stimulus fueled economy is booming. We are forecasting output will end the year higher than it would have done if there had been no pandemic and the economy had instead continued along its 2014-19 trend. However, the pandemic has led to scarring in the economy that means we are concerned that supply capacity won’t be able to keep pace with this demand.
Demand is booming, but is supply capacity?
ING's forecasts for the path of the economy
Rising commodity and freight charges, combined with supply chain disruption and component shortages have obviously put up costs. Labour shortages are also on the rise as home schooling requires many parents to focus on childcare rather than go to work while extended and uprated unemployment benefits mean firms are having to pay higher salaries to attract staff. Fortunately for business, a strong demand environment means these higher costs can be passed onto consumers.
Yesterday’s NFIB small business survey for April showed a ten percentage point jump in the proportion of businesses currently hiking prices to a net 36% – the highest reading since 1981 – while the same net balance is recorded for those firms looking to raise prices in the coming 3 months. Similar readings are seen in other regional surveys, which suggests the risks are skewed to a more prolonged period of elevated inflation readings.
Watch housing costs in coming months
This could be compounded by housing costs since primary rents and owners’ equivalent rent account for a third of the CPI basket. Movements in these components tend to lag 12-18 months below house price developments, as the chart below shows, since rents are only typically changed once a year. This means that the housing components may well be the story to watch through the second half of this year.
CPI Housing costs to swing sharply higher in response to red hot property market

With the economy roaring back, jobs returning and inflation likely to remain higher for longer we continue to see the risks skewed towards an earlier interest rate rise – 1Q23 – than the Federal Reserve is currently projecting – early 2024.
This publication has been prepared by ING solely for information purposes irrespective of a particular user's means, financial situation or investment objectives. The information does not constitute investment recommendation, and nor is it investment, legal or tax advice or an offer or solicitation to purchase or sell any financial instrument. Read more
Download
Download article