US housing: Still going strong but for how long?
A mixed month for US housing data, but the overall direction remains upwards. The question is, how long will this trend continue?
Sales are down
Several key data for the US housing market pointed downwards in April. Sales of both new and existing homes fell relative to March, and by somewhat more than consensus expectations. New home sales in previous months were also revised down. Pending homes sales also fell by 1.3% month on month, again well below consensus, indicating sales are likely to slip further over the next couple of months.
One key reason for slowing sales is the dearth of houses on the market. The supply of homes for sale relative to the current pace of sales keeps falling and with less than four months of supply available is now at the lowest level since the 1990s. That makes it difficult for buyers to find a home they want to buy. Rising mortgage rates also make it harder for buyers, and to some extent could discourage potential sellers from moving house if it means they may end up with a more expensive mortgage.
Though construction is powering ahead
At least the construction of new homes is increasing at a brisk pace. In April, new starts and new building permits fell slightly compared to March. But that was largely due to upwards revisions to the March data, as actually the data release was positive news. Compared to a year ago, new construction is increasing by nearly 10%. That means supply should eventually start to catch up with demand.
The current lack of supply coupled with robust economic growth and wage growth is also pushing up prices. The latest price data from March shows a year on year increase of 6.5% in the S&P/Case-Shiller national house price index. That’s well above the pace of average wage growth. With mortgage rates continuing to rise, affordability is getting steadily worse. US tax cuts have boosted disposable income, but reductions to the tax benefits on mortgage payments make the effect on housing affordability ambiguous.
But how long can it last?
Taking a step back, the obvious question is how long these trends can persist. After all, we know from history that house prices can’t keep rising faster than wages indefinitely. And when house price growth slows, it is often an indication that the economy will slow down as well.
So how far are we from an inflection point? As ever, predictions are difficult.
House price increases and wage growth

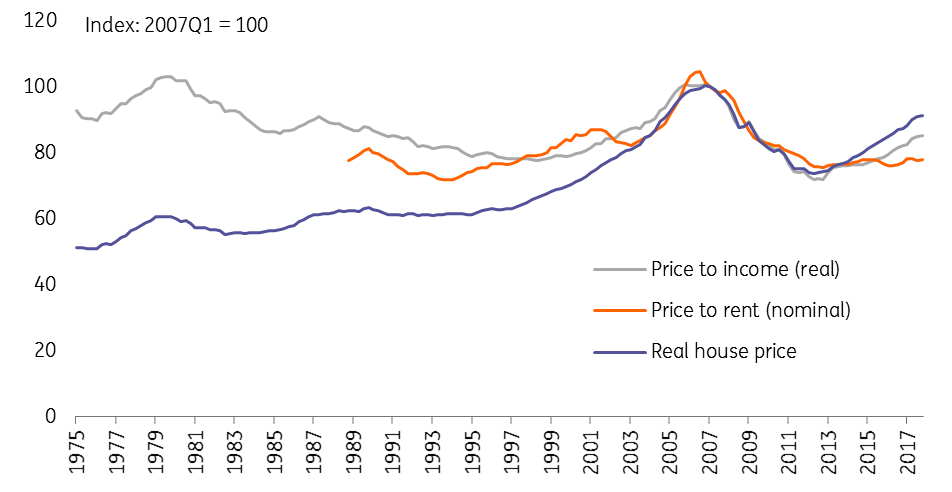
The current pace of house price increases is actually fairly modest compared to previous peaks in price growth, which suggests the turning point could be some way off. Other measures of house price valuation, such as real house prices (discounted for inflation) or house prices relative to rent or income, are currently also well below their previous peak in 2006. But that was at the top of a massive bubble. We shouldn’t really expect to see these indicators return to those elevated levels again before the next downturn. Indeed, it would be very worrying if they did.
US Housing valuation measures compared to 2017

The other key piece of the puzzle is supply. For house prices to decline meaningfully, there needs to be an excess of houses for sale relative to buyers willing and able to pay for them. Despite the healthy pace of housing construction and deteriorating affordability, such a situation looks like it is some way off. That said, there is anecdotal evidence in some markets, such as New York City, that there may be an excess of high-end new-built apartments coming onto the market.
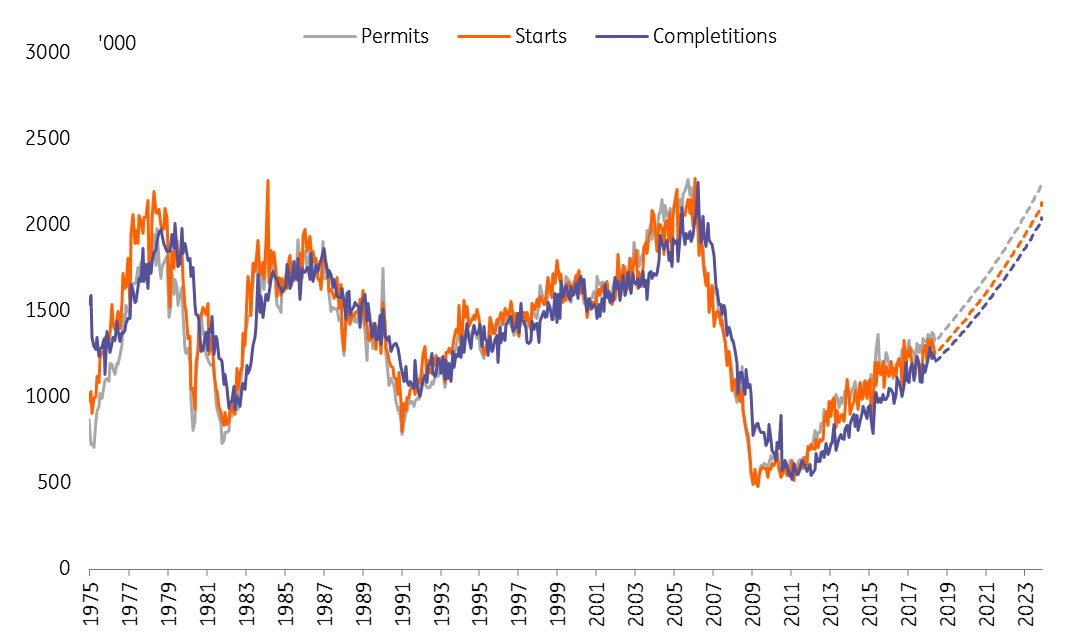
Even if construction continued to increase at a very robust 10% YoY rate (which is improbable), new construction wouldn’t match the 2006 peak until mid-2023. Again, it’s unlikely that construction will actually reach pre-crisis levels again, not least as the growth in new households has slowed considerably since last decade. But the current lack of supply is unlikely to turn into a glut in the near term.
US housing construction, actual and projected assuming 10% growth

Well, probably a while yet
On balance, we don’t think the US housing market is about to turn south just yet. The most plausible scenario is that house prices continue to rise at a decent clip while construction grows fairly rapidly for at least another year or two. Of course, a sudden slowdown in the economy, for example, if the Trump administration triggers an all-out trade war, could bring that rosy outlook to an abrupt end.
But as a baseline forecast, a broad-based downturn in the US housing market looks more likely to be a story for the second half of 2019 or 2020. By coincidence, that is also a probable time frame for the US yield curve to invert, another powerful signal of a coming recession.
This publication has been prepared by ING solely for information purposes irrespective of a particular user's means, financial situation or investment objectives. The information does not constitute investment recommendation, and nor is it investment, legal or tax advice or an offer or solicitation to purchase or sell any financial instrument. Read more
Tags
HousingDownload
Download article
5 June 2018
In case you missed it: Big week ahead This bundle contains 8 Articles