US housing market in gridlock, with risks emerging
- 16 August 2023
- United States
High mortgage rates are crushing demand while owners that want to sell and move are trapped on cheap mortgages, which limits supply. The result is that prices are rising again in many areas. It may be that eventual Federal Reserve rate cuts unleash pent-up supply and that could potentially be the trigger for renewed price falls next year


Mortgage rates at 22-year highs
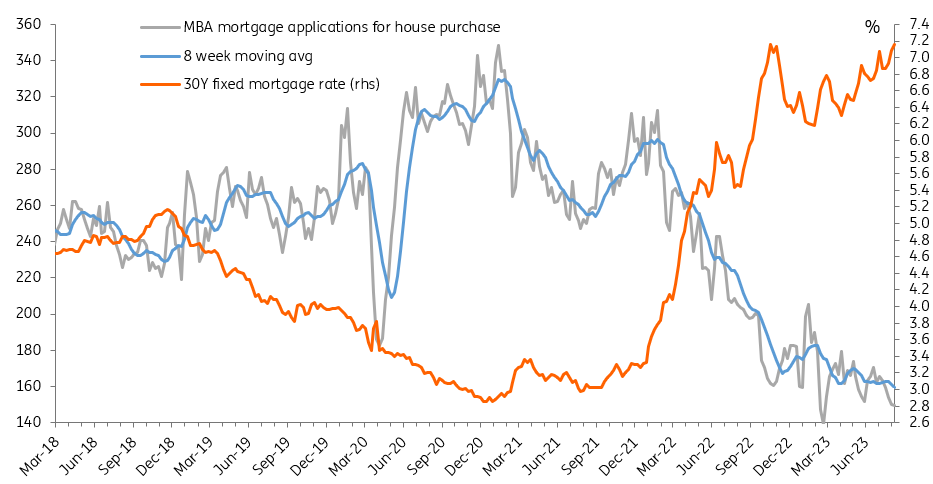
Today's Mortgage Bankers Association data shows the average 30Y fixed rate mortgage agreed last week came in at 7.16%, matching the high hit on 21 October last year. The last time it was higher than this was December 2001. Unsurprisingly, demand for a new mortgage for a home purchase fell yet again. The number was lower in mid-February, but aside from that you have to go all the way back to 1995 for when there were fewer mortgages applied for a new home purchase – note that the US population back then was 70 million fewer than it is today (260mn versus 330mn). The chart shows what has happened since 2018.
Mortgage rates and demand for mortages
Fed rate cuts could unleash supply and prices correct
The average mortgage taken out for a purchase last week was $417,200, which at 7.16% works out at a monthly payment of $2,820. At mortgage rates prevailing late 2021 that same monthly spend of $2,820 would have allowed you to borrow $670,000. This highlights how many households that would like to move are trapped right now. Even if homeowners were to downsize they would end up paying more given the huge swing in mortgage costs. Consequently housing supply has fallen just as rapidly as housing demand, hence why prices have stabilised and are moving higher again in several areas.
A growing concern out there is that if the Federal Reserve does eventually cut interest rates next year and Treasury yields fall, dragging mortgage rates lower, that could suddenly release the floodgates on pent-up supply. Demand may not rebound quite so quickly, especially if unemployment is higher and banks remain cautious on lending, as suggested by the recent Senior Loan Officer Opinion survey. Consequently, we are increasingly of the view that home prices will trend flat to slightly higher through the rest of this year before moving a lower again next year.
Housing starts rise, but sentiment points to a slowdown
Meanwhile, Housing starts – a measure of home construction – came in at 1,452k in July, up from a downwardly revised 1,398k in June that was initially reported as 1,434k. Building permits were flat on the month. Yesterday's National Association of Home Builders builder sentiment index posted its first fall since December on declining prospective buyer traffic and a renewed rise in construction costs.
Housing starts and homebuilder sentiment
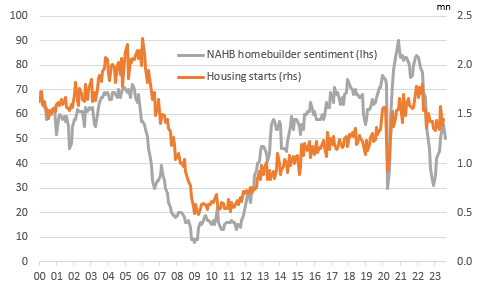
This hints of potential caution on the outlook for profit with movement changes in the NAHB survey typically leading housing starts by around six months. With banks also increasingly reluctant to lend on construction projects, this underscores the risk that the US housing market could become a drag on US economic activity, be it through construction, weak transactions impacting retail sales (furniture, furnishings, building supplies), or through eventual price falls leading to deteriorating credit quality and a hit to confidence.
US industrial output surprises to the upside
US industrial production provides another upside data surprise, but again with hefty downward revisions and is completely contradicting the ISM manufacturing report which indicates the sector has contracted for nine straight months. Manufacturing rose 0.5% month-on-month in July having fallen 0.5% in June while industrial production rose 1% having fallen 0.8% in June. In terms of manufacturing, the gain was almost entirely due to the auto sector.
Level of US manufacturing autos versus non autos
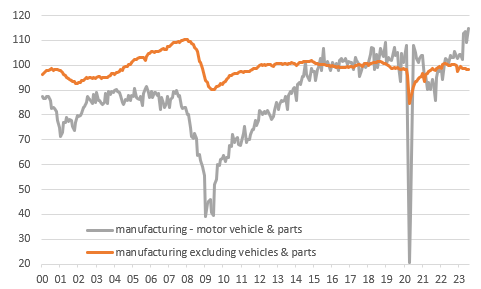
Motor vehicles and parts output rose 5.2% MoM to stand 10.3% year-on-year higher, but manufacturing excluding autos rose only 0.1% and stands 1.5% lower than this time last year. Utilities output jumped 5.4% reflecting weather-related demand surge while mining/drilling fell 1.8%. By way of reference point, the chart above shows that US manufacturing excluding autos is below where it was 22 years ago while US auto output is at record highs.
Content Disclaimer
This publication has been prepared by ING solely for information purposes irrespective of a particular user's means, financial situation or investment objectives. The information does not constitute investment recommendation, and nor is it investment, legal or tax advice or an offer or solicitation to purchase or sell any financial instrument.Read more