Trade tensions accelerate move of China’s factories
China's move up the value chain is re-shaping global trade as we know it and the trade war with the US is speeding up the process
Executive summary
- As China's economy matures, its pace of growth is slowing.
- Chinese firms are switching from labour intensive production to production of higher value added products and services.
- Wages are rising and the economic model is shifting towards consumption growth.
- Higher wages mean that labour intensive production is moving out of major Chinese cities towards cheaper rural areas, as well as to other countries like Vietnam.
- Some western production currently outsourced or offshored to Asia may be back-shored or near-shored to the west.
- Automation is an opportunity to hold onto activities plagued by rising wages but it won’t stop the shift in global trade flows.
- The US-China trade war is accelerating this trend as major companies such as Ikea are relocating production in Vietnam to avoid US tariffs.
- The growing importance of Chinese consumption in its economy implies less import growth since consumption is less import-intensive than exports or investment.
- China is also sourcing ever more inputs from domestic suppliers, thereby further suppressing the importance of imports.
- Outsourcing and offshoring by Chinese and western companies to other Asian counties is leading to diversification of trade flows in Asia.
- China's declining import share and slowing economic growth rate hollows out the position of China as the locomotive of world trade.
Introduction
Forty years after the start of its "reform and opening up" policy, China is reinventing itself once again. Threatened by an ageing workforce and lagging productivity, factories are in transition mode, changing both what they do and where they do it.
This transformation, which has meaningful implications for the overall economy and for global trade, has gained momentum amid escalating trade tensions with the US. But it's also been a long time in the making.
Back in the early 1990s when China first really started to engage in Global Value Chains (GVCs), an abundance of low skilled and low paid workers made Chinese firms perfectly suited to perform low value added activities such as final product assembly. During this period, investments and exports were the primary drivers of Chinese economic growth. The industrialising Chinese economy expanded at a staggering pace, with growth of around 10% a year, peaking at 14% in 2007.
From the early 1990s to 2005, foreign inputs as a share of Chinese gross exports rose from approximately 10% to over 35%, according to TiVA and WIOD[1] data. This caused the share of imports in the Chinese economy to increase by more than half (Figure 1), helping to fuel spectacular growth in world trade in the 15 years running up to the financial crisis.
Since then, however, things have moved on. Wages have risen, China is rapidly automating production and the US-China trade war is reinforcing the economic incentives for factories to relocate, all of which points to a potential sea change in the balance of international trade.
Figure 1: Imports as share of GDP
Volumes in 2017 prices and exchange rates

- [1] TiVA – Trade in Value Added database of the OECD consist of Input-Output based data. The WIOD – (World Input Output Database) are international Input Output Tables published by the University of Groningen.
Chinese upgrading and trade
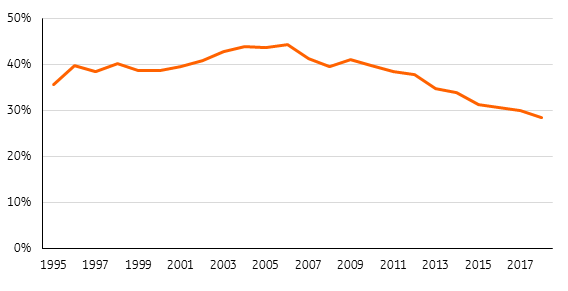
In the mid-2000s, China began to upgrade the type of activities it performed in GVCs and also started to produce more of the required inputs domestically. This is clearly visible in the falling share of Chinese re-exports with imported materials (Figure 2). For example, China-based suppliers producing for Apple have doubled the inputs they source from within China, according to the FT.
Chinese industries are upgrading and increasingly sourcing inputs from the domestic market.
Figure 2: China is importing less inputs for its exports
Re-exports, % of total exports
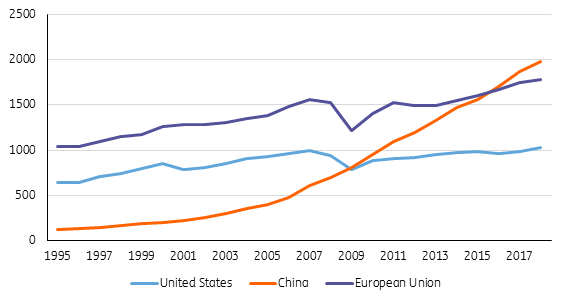
Another sign that Chinese industries are upgrading is the impressive increase in value added earned by China in medium-high tech industries, overtaking the EU in 2016 (Figure 3). This contributed to the fall in the Chinese import ratio.
Figure 3: China becoming a large player in medium-high tech industries
Sector output medium–tech industries (2010 US$ bn)
At the same time, rising wages fuelled domestic consumption, which started to play a larger role in Chinese GDP growth. Domestic consumption is less import intensive in comparison to exported goods or investment goods. This also contributed to the fall of imports as a share of Chinese GDP.
In recent years, the fall in the import ratio has been bottoming out. However, given the Chinese policy to source more inputs from domestic suppliers, we see the possibility for a further drop in the import ratio towards the level of the US at 12% from just above 15%. A continuation of the current trade war with the US, which raises the price of American inputs, could also fuel this trend towards more local sourcing. On the other hand, rising wages could induce more offshoring of Chinese intermediate production leading to a higher import intensity. The outcome of these opposing forces will determine the direction of China’s import ratio in the coming years.
The strength of Chinese GDP growth compared to other large economies is the reason that Chinese imports have continued to grow faster than the global average, despite the downward trend in the import ratio. As the economy rebalances towards a more consumption-driven model, growth rates will move closer to those seen in developed economies (Figure 4), which means that world trade will lose its main driving force.
Figure 4: Slowing GDP growth in China

As China’s economy is maturing, it is growing at a slowing pace
“Made in China 2025”
Another factor that will put a lid on China’s growth potential is ageing. Decades of one child policy have left the country with a population that is rapidly growing out of its working age.
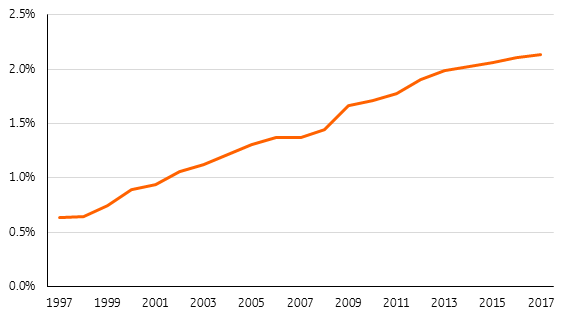
The government’s strategic plan for upgrading high-tech industries, often referred to as “Made in China 2025,” is in part, a response to this problem. China wants to boost productivity to compensate for its shrinking labour force and it has set ambitious research and development targets. Currently, China spends roughly 2.1% of its GDP on R&D, investing in and significantly subsidising the acquisition of new technologies.
Launched in 2015, the 10-year plan targets 10 industries, including quantum computing, artificial intelligence and chip making. It aims for these sectors to source 40% of all “core” inputs domestically by 2020 and over 70% by 2025. The Chinese government has established over 1000 state guided funds that together manage over US$5 trillion in assets. These funds are investing in tech start-ups in fields such as robotics, aerospace and advanced battery making.
Chinese innovation capacity is growing.
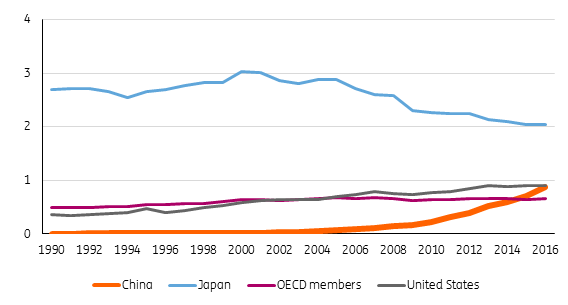
One sign of China's maturing position in value chains is the increasing innovation capacity, as measured by patent fillings. Figure 5 shows that the number of patent applications has reached levels comparable to those of advanced economies in recent years.
Figure 5: China registering more patents
Annual number of patent registrations per 1000 residents
However, parts of China’s ambitious strategy could prove challenging. Despite the emphasis on high-tech investments in the “Made in China 2025” plan, we have seen no acceleration in R&D spending since the plan was announced in 2015 (Figure 6). Without faster growth, R&D levels will struggle to meet the 2020 target of 2.5% of GDP.
China’s ambition to become self-sufficient in the production of advanced computing chips also remains a challenge. About two thirds of the semi-conductors sold and processed in China are still imported. Top tier electronics firms remain dependent on US silicon. For example, ZTE, one of China’s flagship tech firms had to halt production because the US temporarily banned the sale of semiconductors to the firm due to sanctions for doing business with Iran and North Korea.
Figure 6: China spending more on R&D
China R&D expenditure % of GDP
Relocation of Chinese factories
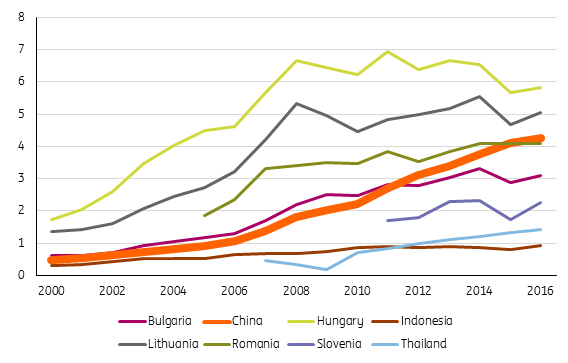
The rise in Chinese wages in recent years has brought the average hourly wage rate to levels seen in emerging Europe. Comparability of average wage data across countries is not without problems, but even when taking into account a significant margin for error, the rise in Chinese wage costs remains impressive (Figure 7).
Figure 7: Chinese wages catching up with other emerging economies
Mean hourly wage in nominal US$
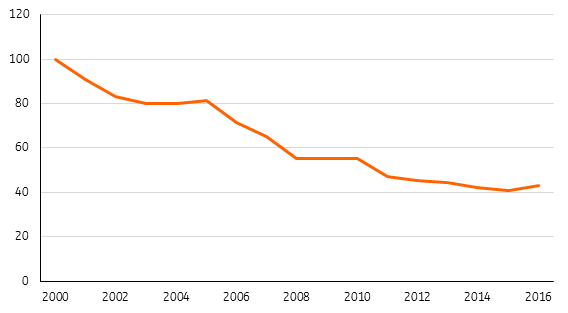
While nominal wages in China have been rising, productivity has grown even faster. This is largely due to investments in machinery and robots (automation) resulting in more output per worker. This has resulted in an overall fall in unit labour costs (Figure 8).
Figure 8: Chinese productivity growth causes falling unit labour costs
Mean hourly wage in US$ per unit of output
However, this downward trend in unit labour costs does not hold for all industries. Some labour intensive production is difficult to automate and still relies disproportionately on manual labour. Examples include clothing production, household appliances and toy manufacturing. These types of industries haven't experienced steep increases in productivity but are nonetheless facing higher wages. These industries have been relocating to China’s countryside where wages are lower. Workers inland and in western China have been earning 75%[2] of the average wage in the coastal provinces.
Despite the overall decrease in unit labour costs, labour intensive production has become more expensive in China.
Other advantages of relocating to the countryside are lower factory rents and government subsidises on new factories, as part of the government’s strategy to revitalise China’s inland provinces. For example, Jintai Garment, a clothing manufacturer based in the coastal province of Zhejiang, has built 17 factories in the inland region of Henan, employing about 2600 workers.
Figure 9: Chinese inland freight traffic rapidly rising
Trillions of tn-km transported by road
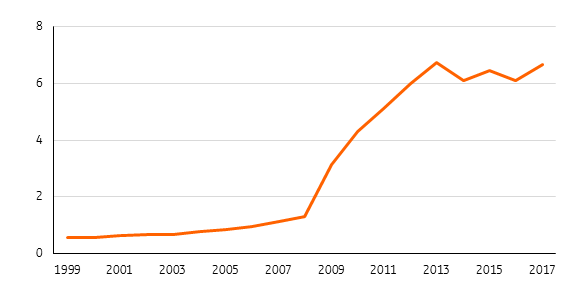
The relocation of factories to inland China has coincided with a vast increase in inland freight traffic (Figure 9), indicating increasing economic activity in the non-coastal regions of China.
In recent years, this relocation towards inland China has slowed as wages in inland regions are also on the rise.[3] Companies suffering from rising Chinese wage costs have already been relocating to neighbouring countries, with many foreign manufacturers among them. Notably, Japanese automotive companies such as Honda and Yamaha now employ a “China plus one” strategy. This means that, in addition to China, firms have a second production location in a low wage economy within Asia. The most common locations are Vietnam, India, Indonesia, Thailand and the Philippines. Manufacturers are retaining a presence in China to maintain access to China’s large market, but they're looking elsewhere, too.
As wages have been rising in coastal China, industries have been moving to inland regions.
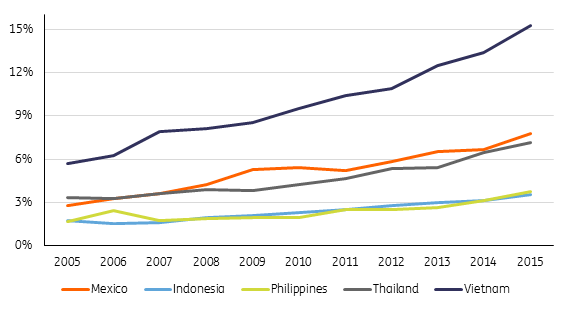
Firms (both Chinese and foreign) are increasingly active in outsourcing lower value added activities to neighbouring Asian countries. Figure 10 shows that Chinese value added in the gross exports of Vietnam, Thailand, and Mexico has increased significantly in recent years, indicating a shift of assembly activities from China towards these countries. Figure 12 shows Green Field FDI figures indicating the increasing popularity of Vietnam for offshoring among the major East Asian economies.
Western companies, meanwhile, are engaging in near-shoring activities to bring production closer to western consumers. Mexico fulfils this role for companies that service the US market while emerging Europe services demand for Europeans.
Figure 10: China’s growing role in the exports of other emerging economies
Chinese value added in gross exports to EU, US and Canada by selected economies. Chinese value added as % of total gross exports by country.
The trade war between China and the US is also a trigger to move (parts of) production from China to other countries, so that American import tariffs can be avoided. The Financial Times reports that Pegatron moved part of its production from China to a rented factory in Indonesia to circumvent US tariffs. Large furniture companies such as Ikea have also reportedly switched to a Vietnamese supplier, in part because of the trade conflict.
Industries are increasingly relocating production from China to other countries, and the China-US trade war seems to be accelerating this trend.
Despite the upgrading of activities and higher wage costs, we should stress that China will remain a manufacturing powerhouse for mass production in the foreseeable future. The size of the country and its population, as well as the willingness of the Chinese population to move, allow for economies of scale not achievable anywhere else. While the reported maximum factory size is about 20,000 workers in most Asian countries, Chinese plants are vastly bigger. Some of Pegatron’s Chinese factories host 80,000 workers. The Foxconn factories are even larger, hosting from 100,000 to 300,000 workers. The sheer size of the economy will remain a counterweight to the benefits of lower wages in other countries for some time to come. This is particularly true given the rising trend of automation, raising worker productivity.
The role of automation
China is rapidly automating production. In 2014, President Xi Jinping called for a “robot revolution” in the manufacturing industry. Since 2015, the Chinese working population (age 15 to 64) has been decreasing. This decline will continue for the foreseeable future, while the total Chinese population keeps on growing. In order to maintain strong economic growth and support the elderly in China, productivity growth is needed to compensate for the declining working population.
If there were no further productivity growth in China, GDP per capita would be 5% smaller by 2030. To attain the current target of 6 to 6.5% economic growth, productivity needs to grow by 6.3% to 6.8% per year.
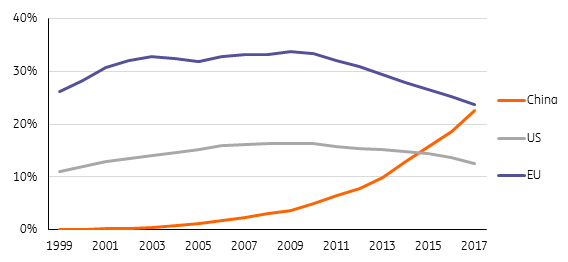
Automation is an important driver of productivity growth. According to statistics by the International Federation of Robotics, the average number of robots per 10,000 employees increased from 25 to 68 from 2013 to 2016. Over the last decade, the share of Chinese robots in total robots worldwide more than doubled (see Figure 11).
Figure 11: China's is robotising production rapidly
The US, EU and China’s operational manufacturing robots as % of world total.
The China Development Research Foundation showed that manufacturing companies have cut 30% to 40% of their labour force because of automation between 2015 and 2017.
Automation first took off in the automotive industry but has spread rapidly to other Chinese sectors such as electronics manufacturing and metals. In less productive industries, such as textiles or toy manufacturing, automation is less prevalent and some companies have been relocating to China’s low wage neighbours. Industries that can be automated to a larger extent are more likely to stay in China, particularly because of its large and growing domestic market for consumption. At the same time, automation makes it viable for some foreign companies to move production for the European or American markets back to the home market.
New Asian production El Dorados
As mentioned, some firms are relocating labour intensive production, such as garment manufacturing or toys, to other Asian countries.
Figure 12 shows the 10 Asian countries in which Chinese (greater China), Japanese and South Korean firms invest the most. These investment flows show the jobs added in countries and sectors by foreign investment. A lot of manufacturing activities that are being relocated also take the shape of cross border outsourcing, which is not captured by international investment flows. Hence outsourcing is not shown in Figure 12. Still, Green Field FDI flows are part of the story of relocating industries and indicate which countries and sectors are most attractive to firms seeking the most efficient production location.
Figure 12: top 10 Asian investment destinations for manufacturing
Green Field investments in manufacturing industries by Greater China, South Korea, and Japan, Data in thousands of jobs (Cumulative figures for period)
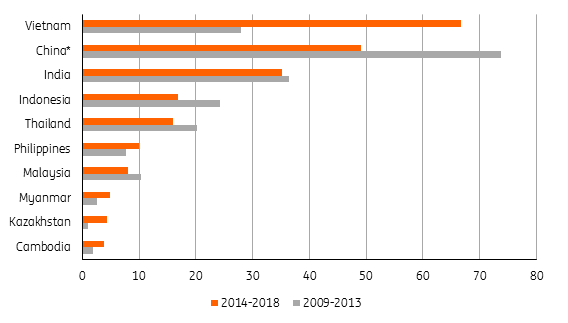
Vietnam attracts most investments in the production of textiles, basic electronics, and consumer products. Investments in India and Indonesia are more popular among producers in the automotive and metal sectors.
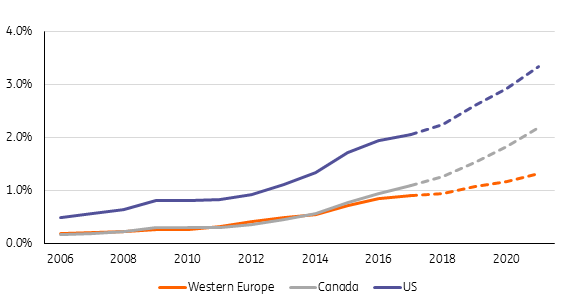
Vietnam is the most favoured destination for offshoring or outsourcing production. In 2014 and 2015, the government passed a number of reforms (labour, land, competition, and taxes) with the intention of attracting more (foreign) investment. The development of Vietnam as a manufacturing location is also visible in the rising share of Vietnamese goods in the import baskets of advanced economies (Figure 13).
Figure 13: Vietnam's growing importance as an exporting economy
Share of imports from Vietnam in the total imports of western Europe, Canada and the US
The rise of Vietnam as a manufacturing power within Asia is also visible in its share within intra-Asian imports, which has more than doubled since 2011
(Figure 14).
Figure 14: Vietnam becoming more important in intra-Asian trade
Share of Intra Asian Imports involving Vietnam
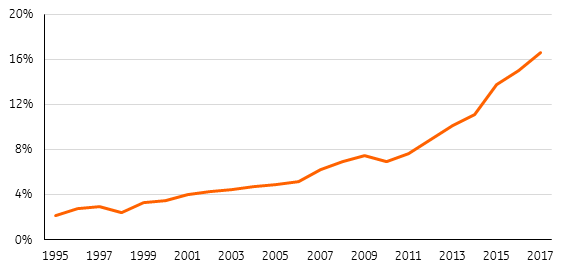
The growth of Vietnam’s share is mostly driven by bilateral trade between Vietnam and Korea, Japan and China. Both Vietnamese imports and Vietnamese exports from and to these countries have shown strong growth. This is likely a result of Vietnam integrating into regional value chains.
Diversification of Asian trade flows
The transition of China will lead to a shift in the balance of Asian trade. Panel A in Figure 15 shows a sterilised picture of trade flows involving China over the past decades. Where China has been an offshoring and outsourcing destination, China imports a lot of durable intermediates from the advanced economies to be processed in final goods. China exports these final goods to the world’s main consumption markets.
Figure 15: Trade flows will diversify towards new emerging Asian economies
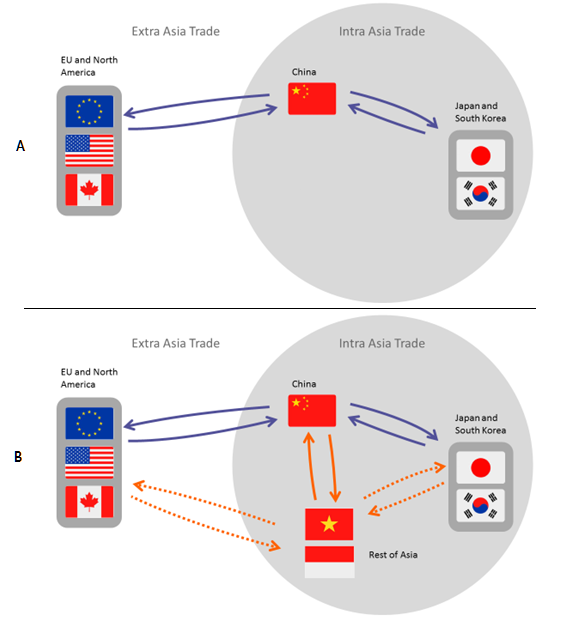
Now that foreign and Chinese firms are relocating manufacturing of some lower value added industries from China to other Asian countries, China and the advanced economies will be exporting more intermediates to the rest of Asia. The final goods produced in the rest of Asia will then be shipped to the advanced economies and China for consumption. Trade flows between the rest of Asia and advanced economies, (dashed arrows) will therefore grow at the expense of trade between the advanced economies and China. Additionally, since China’s market for final goods consumption is maturing, China will also import more final goods from advanced economies.
China is upgrading its industries fast and is increasingly sourcing high value added intermediates domestically. This will likely result in China importing fewer intermediates from advanced economies and growing exports of intermediates to the rest of Asia. In addition, as a result of recent developments in automation and robotisation, labour costs are becoming less relevant for some industries, which means some production currently outsourced or offshored to Asia may be back-shored or near-shored to the west. This may lead to the decreasing importance of extra Asia trade.
Figure 16: Developments in in Asian regional trade
% of total trade
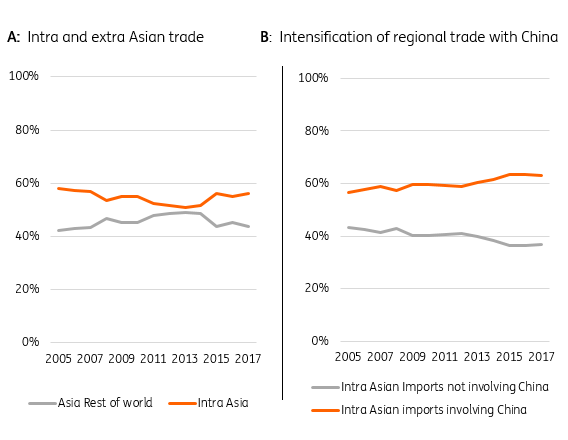
These trends are clearly visible in Asian trade flows. Intra-Asian imports have been growing stronger than Asian imports from the rest of the world since 2013 (Figure 16A). This intensification of regional trade is primarily centred around China. The share of intra-Asian trade involving China increased by four percentage points between 2012 and 2015.
In 2016 and 2017, the trend of China's increasing dominance in Asian trade seemed to come to a standstill and even reverse a bit. Due to opposing forces at work, it is very difficult to determine whether this trend will continue in the years to come. However, we expect that China’s trade flows within Asia will be more diversified towards new emerging Asian countries such as Vietnam, Indonesia and the Philippines.
THE ASEAN GROUP
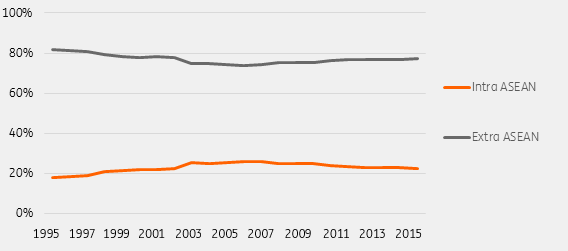
The ASEAN group is a regional grouping among South Asian countries[4]. The combined GDP of the ASEAN group is about US$2.8 trillion. Although the ASEAN group promotes regional economic integration, it has shown a slight trend towards de-regionalisation with regards to trade in recent years. This is mostly due to a deepening of the trading relationships between the ASEAN countries and China.
- [4] The ASEAN is a free trade agreement between Indonesia, the Philippines, Vietnam, Thailand, Myanmar, Malaysia, Cambodia, Laos, Singapore, and Brunei.
Conclusion
China's transition is far from over.
In the coming years, wages are expected to keep rising while Chinese and foreign companies, which don’t experience high productivity growth, will continue to outsource or offshore part of their production to neighbouring countries. The US-China trade war is speeding up the relocation of these industries.
China’s grand plan to upgrade its industries from mass production to production of high value added products and services is aimed at boosting productivity to maintain high levels of growth. If successful, the relocation of production activities away from China may be modest, limiting the growth of intra-Asian trade. It is not clear if intra-Asian trade will grow significantly stronger than extra Asian trade.
But a diversification of China’s trade flows towards new emerging Asian economies such as Vietnam, Indonesia and the Philippines is a trend that's here to stay. Further change is coming.
This publication has been prepared by ING solely for information purposes irrespective of a particular user's means, financial situation or investment objectives. The information does not constitute investment recommendation, and nor is it investment, legal or tax advice or an offer or solicitation to purchase or sell any financial instrument. Read more
Download
Download article
16 May 2019
What’s happening in Australia and around the world? This bundle contains 6 Articles