The case of the ever-shrinking sovereign and SSA greenium
Germany, the UK, and perhaps Belgium will launch new green bonds this autumn. This jump in supply comes as the greenium on sovereign and SSA curves is shrinking, which we link to worsening liquidity conditions in sovereign bond markets
Greenium takes it on the chin in illiquid markets
As is the case in many markets, 2022 has proved a bruising year for green bonds. There remains a frustrating heterogeneity in how the greenium trades across sovereign and SSA (Sub-sovereign, Supranational, and Agencies) curves. As we have highlighted in previous reports, we find a greenium, ie a tendency for green bonds to trade with lower yields than their peers, exists on most curves but this hides discrepancies between green bonds within the same curves, and there's no uniform way of pricing greenium from one curve to the next. And yet, ironically, the 2022 market turmoil has, for the first time shown, the beginning of an analytical solution to this green bond pricing conundrum.
2022 has brought a reduction in greeniums, and greater dispersion
The UK, Germany, and in our view Belgium, will soon find themselves in the headlines due to new green bonds issuance. All three have seen their greeniums shrink over the past few months, albeit by varying degrees. As is often the case, some markets bucked that trend, for instance, the Netherlands, but we find this an interesting development nonetheless given the lack of correlation between greeniums, and given the worsening liquidity conditions that have recently characterised markets.
Various indicators of market liquidity have gradually worsened this year
As regular readers know, we have repeatedly stressed the worsening trading conditions in government bond markets this year, owing to both macroeconomic uncertainties and a change in market structure with central banks stopping their QE programmes and, in some cases, going into reverse. Even in markets where balance sheet reduction isn’t yet a reality, recent comments by ECB officials Isabel Schnabel and Joachim Nagel confirmed that this should be on investors’ radars over the medium term. The upshot is that various market liquidity indicators have gradually worsened this year, with summer trading conditions also adding to existing problems.
Finally some explanation for greenium changes
That worsening of liquidity conditions and shrinking of sovereign greeniums is more than a mere coincidence. We find that bid-ask spreads and realised volatility, our two proxies for liquidity, have the greatest explanatory power when trying to model the greenium on sovereign and SSA curves. The contribution of each factor varies from issuer to the next but the signs and relevance are consistent. This is a remarkable result given the lack of uniformity in pricing greeniums. For instance, the correlation between each bond’s greenium on the same curve is very weak, and the greenium across curves is also insignificant.
Green German bonds seem to be less liquid than their non-green peers
The tendency of the greenium to shrink when liquidity worsens is not a reflection of the liquidity of green bonds specifically, but rather an effect of trading conditions across all bonds on a curve, green or not. We find that green bonds are sometimes more and sometimes less liquid than their non-green peers depending on the curve. In Germany for instance, notably with a ‘managed’ greenium, green bonds aren’t more liquid than their peers, but the reverse is true for KFW, the large German SSA issuer.
Higher bid-ask spreads and realised volatility caused a lower German greenium
None of this means liquidity conditions are to blame for the existence of a greenium in the first place. An imbalance between supply (possibly slowing this year, see below) and demand (with green reserve management a new potential driver for future growth) remains the prime suspect.
Liquidity is a key driver of day to day greenium changes
As an aside, it still doesn’t look like supply has caught up enough for demand for greeniums to disappear, although we can argue that a better balance between the two could have allowed secondary factors to play a more significant role. For now, liquidity is a key driver of day-to-day greenium changes. It is notable that a change in market regime characterised by higher volatility and less generous liquidity conditions has upended the way many markets behave; green bonds are no exception.
Masked by volatile Supra issuance, overall EUR denominated SSA ESG supply is still gaining traction
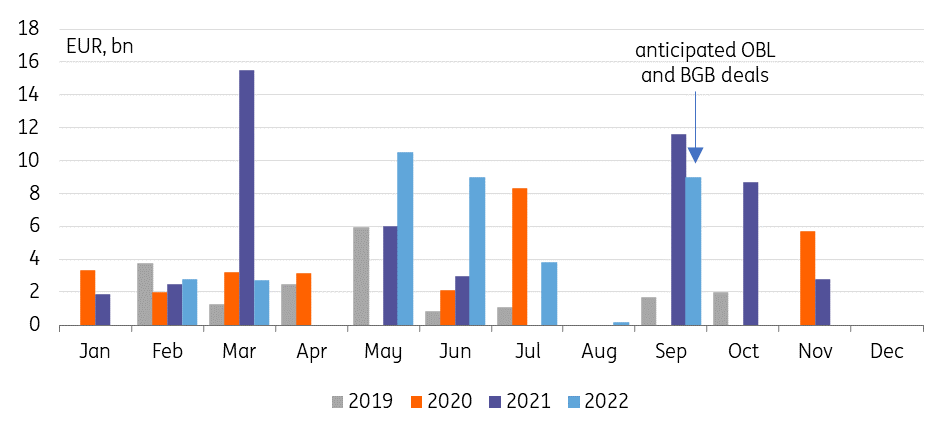
Germany and likely Belgium are the next large eurozone sovereign issuers that will become active in the green bond space. Germany has just kicked off investor meetings for the upcoming launch of a new 5Y green bond via syndication which should take place in September.
Markets are also still awaiting Belgium’s new green bond which had been flagged in the funding outlook, and given the issuer's typical pattern it also looks likely to come in September. It is anticipated that the new green bond could again be a 15Y following up on the existing 2033 maturity, which was launched in 2018, but also only reopened this month in a small scale. The eventual maturity will probably only be decided after gauging where investor demand lies.
Year-to-date EUR sovereign green issuance stands close to €30bn, compared to €35bn In 2021
The two aforementioned deals would likely already constitute close to €10bn of new green EUR sovereign issuance for September. While alone that's still behind what has been observed in the previous two years, it appears to follow a seasonal pattern where activity notably picks up after the summer. Year-to-date EUR sovereign green issuance stands close to €30bn, only somewhat lower than the €35bn at a similar stage last year and eventually a total of more than €61bn for 2021. But the EUR green sovereign market has only started to mature over the past few years with new major eurozone issuers entering the market with prominent deals, Italy and Spain in 2021 and Austria only this year.
EUR sovereign green issuance pattern still marked by prominent deals

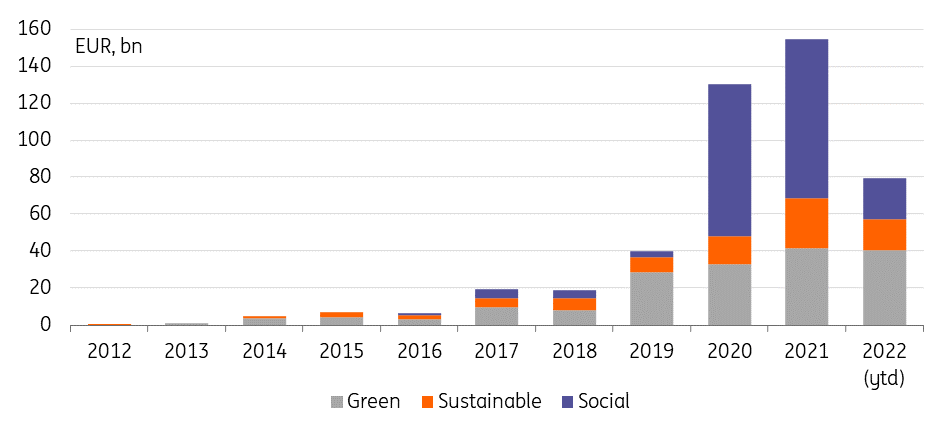
Wider sovereign-related and supranational ESG issuance (excluding aforementioned central government bonds) currently stands at nearly €80bn year to date. €112bn had been issued at the same stage last year, and in total eventually more than €150bn.
Year-to-date EUR SSA ESG issuance currently stands at €80bn, compared to €112bn in 2021
However, social bond issuance over the course of the pandemic particularly led to some distortion of the headline figure given the prominent role of the EU’s SURE programme. It alone raised close to €92bn over a brief timespan from late 2020 to early 2021. This masks an underlying trend where especially green issuance has steadily increased. The EU is of course also a driver of green issuance - we've had the NGEU since last year. That should last longer than the SURE programme,
The EU issued €50bn for the NGEU in the first half of 2022 and has flagged another €50bn for the second. Of the amount issued so far €16bn has been in green bonds, thus slightly more than 32%. This is slightly ahead of the 30% which the EU has still flagged as a funding share for green bonds.
EUR denominated SSA ESG issuance

There's a chance that this year's green sovereign and SSA issuance will outweigh that of previous years but it seems the phase of rapid acceleration seems to be over. Lower, or at least slower growth in supply comes as greeniums shrink and display greater volatility. There is still a case to be made for demand exceeding supply in the long run but the past few months have proven that general market conditions matter. In phases of low market liquidity, a steady greenium can no longer be taken for granted.
This publication has been prepared by ING solely for information purposes irrespective of a particular user's means, financial situation or investment objectives. The information does not constitute investment recommendation, and nor is it investment, legal or tax advice or an offer or solicitation to purchase or sell any financial instrument. Read more
Download
Download article
