Red Sea shipping disruption is set to rage on well into this year
The Red Sea shipping crisis is still growing. Almost half of all vessels were rerouted around the Cape of Good Hope in January. This has already more than tripled container rates, and delays and knock-on effects may well drag into the second quarter

No quick fix for Red Sea shipping risks, impact potentially to drag on
There's no end in sight to the Red Sea security crisis which has been dragging on since the end of last year. To avoid Houthi militant attacks, shipping companies and their clients continue to avoid the major Suez Canal route - handling some 12% of global trade - and are rerouting their vessels around the Cape of Good Hope.
Sailing around the Cape saves Suez Canal fees but adds some 3,000-3,500 nautical miles (around 6,000 km) to journeys connecting Europe with Asia. At a speed of 14 knots, this means more than ten days is added to the length of the trip, potentially running up to two weeks.
The disruption has raged on for over a month, and the US-led naval operation ‘Prosperity Guardian’ has not yet succeeded in removing threats and providing a corridor safe enough to resume transit. And risks are unlikely to disappear anytime soon amid intensified incidents, the ongoing war in Gaza and associated geopolitical tensions in the Middle East. This is rattling the shipping sector as well as shippers and supply chain partners down the line, and the knock-on effects could take us well into 2024.
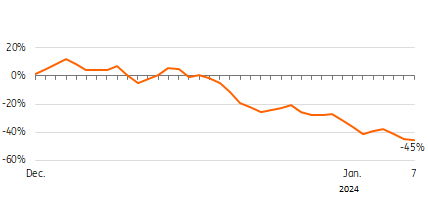
Number of vessels entering the Red Sea has almost halved in the first week of January compared to last year
Daily* number of vessels crossing Bab el Mandeb strait end of 2023-early 2024 year-on-year
What is the magnitude of the forced detours and which flows are most affected?
Vessel crossings nearly halved as number of rerouted vessels mounts
From mid-December onwards, shipping companies, their clients and charterers started to avoid the risky Gulf of Aden and Bab al Mandeb sea strait (30 km), which is the entrance to the Red Sea and the route to the Suez Canal. And these numbers are still increasing. In the first week of January 2024, around 220 fewer vessels took this route compared to the previous year (-41%), and the figure is on a downward trajectory, meaning the rerouting of vessels is still mounting. As many ultra-large vessels are among those being redirected, the impact on trade volumes is even bigger (-47%).
Roughly half of the shipped tonnage crossing the canal are containerised goods, making it the most important artery for container trade. The trade lane is also a vital corridor for shipping oil and oil products from the Persian Gulf to Europe and the US (some 20-25%).
Container vessels most at risk from Red Sea troubles
Most of the rerouted vessels carry general cargo, particularly containers. Car carriers sailing from Asia are also being diverted, but these make up a small cargo fraction. In the three weeks after mid-December, some 80% of the container vessels on the route have been forced to change course, a level which reached 90% in the first week of January (according to Clarksons).
In just three weeks, market leaders MSC and Maersk have diverted over 60 container vessels around the Cape. Other larger container liners, Hapag Lloyd, Cosco, ONE, Evergreen, HMM and ZIM have followed suit. CMA-CGM continues to use the route but is also opting for detours. This effectively means that 9 out of 10 containers on the Suez Canal route are currently sailing a longer way. As a result, global container capacity depletion could potentially go up by 20-25%.
The number of Red Sea sailings has dropped the most for general cargo vessels
Daily number of vessels crossing Bal el Mandeb strait per type (rolling seven-day average)
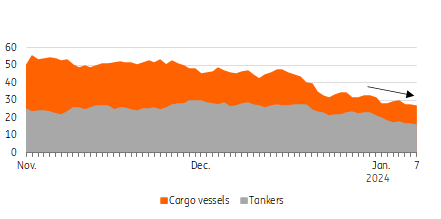
Tankers continue to sail, but the number is diminishing as the risk of assaults comes at a cost
Most tankers are continuing their journeys, but this doesn’t mean the tanker market is not affected by the threat of attacks on vessels. Spot rates, including those for very large crude carriers (VLCC) chartered on this route from the Persian Gulf, are under strain. And in the meantime, insurance market premiums for Red Sea crossings have surged.
So different from what some may think, the Red Sea - Suez Canal shipping route isn’t blocked but is certainly increasingly affected.
What are container rates doing?
Container rates on most affected Asia-Europe route more than tripled while the global average doubled
Container spot rates on one of the largest and most affected global trade routes, Asia-Europe, tripled compared to early December in the first week of January. This marks the provisional end of downward trending prices after earlier record-breaking levels during the pandemic. Spot rates, including surcharges on the Shanghai-Rotterdam route, reached $4,400 on 11 January compared to $1,170 at the start of December for a standardised 40-foot container.
Most trade lanes across the world are indirectly affected, and global spot rates have doubled over the same period. Several US east coast-bound vessels from Asia have shifted away from the Panama Canal, which is suffering from a drought, and are now also impacted by the troubles in the Red Sea. This comes on top of already extended sailing times.
Container rates to Europe have risen rapidly since Red Sea troubles started
World container index (WCI), freight rates in $ per FEU (40 ft container)
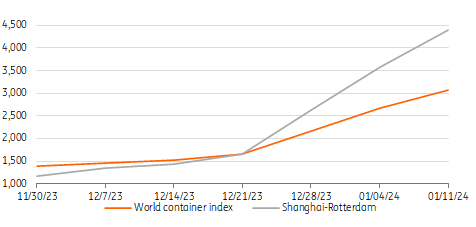
Container rates rebounded quickly and more may follow
Container spot rates have risen rapidly since the capacity disruption and may increase even further. But we are still far away from the record-breaking levels of early 2022. Current spot prices still hover below half of this peak for the Shanghai – Rotterdam route.
A complicating factor for the market is that the world simultaneously faces another choke point – the Panama Canal, which is also a vital link for trade- and the coinciding Chinese New Year may lead to extra friction this year. But on the other hand, demand for goods is running far less hot than over the pandemic, and with a range of new-build vessels online and still underway there’s much more capacity available. In addition, port operations are generally also running relatively smoothly.
Red sea crisis in a different category for shipping than the pandemic disruption
The current market balance of supply and demand is less strained than when Evergiven blocked the Suez Canal in 2021, which should limit the upside for container rates.
Having said that, the impact ultimately depends on how long it takes to resume shipments. Rebalancing takes time as we have seen before. If extreme weather events add to the disarray, elevated freight rates could easily be around for longer. But the current disruption also masks underlying overcapacity following a massive inflow of vessel capacity. When the most pressing Red Sea disruption is resolved, we can gradually expect renewed downward pressure.
Mounting surcharges complicate the market
The container shipping sector is subject to various surcharges on top of base freight rates, and several of them, including the bunker adjustment (BAF) and from this year, the Emissions surcharge (EMS) are covered by clauses in contracts. But the list of surcharges has continued to expand in response to several events in the last few years. Port congestion surcharges (PCS) were introduced over the pandemic and amid the current Red Sea crisis, container liners have implemented ‘transit disruption charges’ (TSD). This extra fee, combined with a peak season surcharge ahead of the Chinese New Year (PSS), has pushed up container rates.
These fees differ among container liners but have become a dominant factor in pricing. Consequently, container transport pricing has turned increasingly opaque and hard to predict for shippers and logistic services' providers.
What is the impact of the Red Sea crisis for shippers and consumers?
Shipping costs up again and delays hit consumer markets in subsequent months
Container vessels predominantly carry finished consumer goods, and semi-finished products are most impacted by the disruption. An estimated 30% of the world’s traded consumer goods are shipped through the Suez route. Higher transport costs obviously raise costs for shippers, but how they are affected depends on specific contracts, although surcharges may hit them even if they have term contracts.
Shipping costs usually make up a small fraction of total sourcing costs per product. For lower-valued or voluminous products, this could, for instance, make up around 5%. If prices double or triple, this raises total costs by 5 or 10%, but we’ve also just gone through a prolonged downward cycle after the pandemic highs. Unless the current disarray lasts longer than expected, the impact on consumer prices may be limited (for now).
Mounting delays of detoured vessels arriving in ports are resulting in increased uncertainty for shippers and handling pressures at terminals. Delays could also spark port congestion and hit the turn-around trip as well as connected journeys. The disruption leads to short-term mismatches between supply and demand and imbalances in the availability of vessels, personnel, and empty containers, and this needs to balance out again. With the Chinese New Year approaching and vessels returning to Asia too late, leading to cancellations. This will likely impact most of the first quarter and potentially the second quarter as well. For time-sensitive deliveries not yet underway, shippers may opt for shipment through the air, but this is much more expensive.
Altogether, this could mean some products will arrive later on the shelves if stocks are depleted, as companies like IKEA have warned about. In any case, questions about reliability lead to challenges in terms of fulfilling demand on time, and it reminds shippers that building resilience in supply chains remains vital.
What does it mean for the profitability of container liners?
Container liner profitability expected to recover in the first quarter
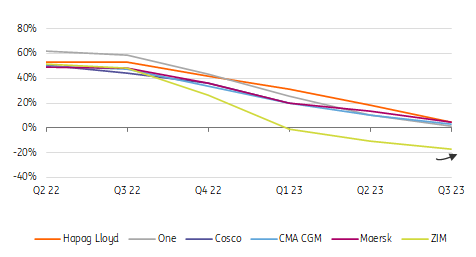
Only part of the price increases can be attributed to higher fuel and wage costs, which means container liners will benefit from the sudden mismatch and imbalances between demand and supply, as we have seen previously. Profits skyrocketed in 2021 and 2022. But container rates plummeted in 2022 and trended down over most of 2023, even dropping below pre-pandemic levels last autumn.
With locked-in higher contract rates expiring, elevated profitability levels have been declining since the second half of 2022. This continued over 2023 with some liners approaching break-even in the third quarter and ZIM even encountering negative levels. With the current price hikes, profitability is likely to turn a corner, and we may see margin improvement either in the fourth quarter or by the first quarter of 2024.
Sinking margins of container liners will likely turn around in 1Q in wake of the Red Sea disruption
Operational profit (EBIT) per container liner, per quarter
What about the impact on trade?
New inefficiencies but trade unlikely to be derailed
Global trade has entered a phase of low growth following economic headwinds, geopolitical tensions and increasing protectionism. Trade growth may even lag global GDP growth for longer than expected. Trade patterns have also been disrupted over the last two years following sanctions on Russia, which led to big shifts in imports and exports of commodities and vessels sailing longer routes, especially in tanker shipping. Current detours add to already historically long routes in trade and introduce new inefficiencies.
Falling container rates have long been positive for trade since 2022, and current increases reverse some of that, but as mentioned previously rates and ocean timelines for shipments are nowhere near peak levels. Shippers are looking into options for shift sourcing and nearshoring to reduce risk, but we’ve also seen that (underlying) interdependencies remain strong and companies continue to trade if potential benefits surpass costs. All in all, we stick to our forecast that merchant trade will grow 2.5% year-on-year in 2024 compared to the low competitive base of 2023.
This publication has been prepared by ING solely for information purposes irrespective of a particular user's means, financial situation or investment objectives. The information does not constitute investment recommendation, and nor is it investment, legal or tax advice or an offer or solicitation to purchase or sell any financial instrument. Read more
Download
Download article