Malaysia trade surplus scales fresh record in July
An all-time high trade surplus in Malaysia comes as reinforcement for the MYR appreciation in the current emerging market rally. But subdued global oil prices, narrowing current account surplus, and politics remain as headwinds to future appreciation
| MYR 25 bn |
July trade surplusHighest ever |
| Higher than expected | |
Another upside export miss
Malaysia’s exports surprised on the upside for the second month in July. A 3.1% year-on-year growth contrasts with the consensus median estimate of a 1.4% YoY fall. This follows the 8.0% growth in June, which was revised slightly from the initial print of 8.8%.
The slowdown in yearly growth stemmed from a high base year effect. We thought the adverse base effect combined with some retracement of a huge 32% month-on-month bounce in June would dent the yearly growth back into the negative territory.
In the end, yet another strong month-on-month surge by 12% saved the day.
Electronics-led strength
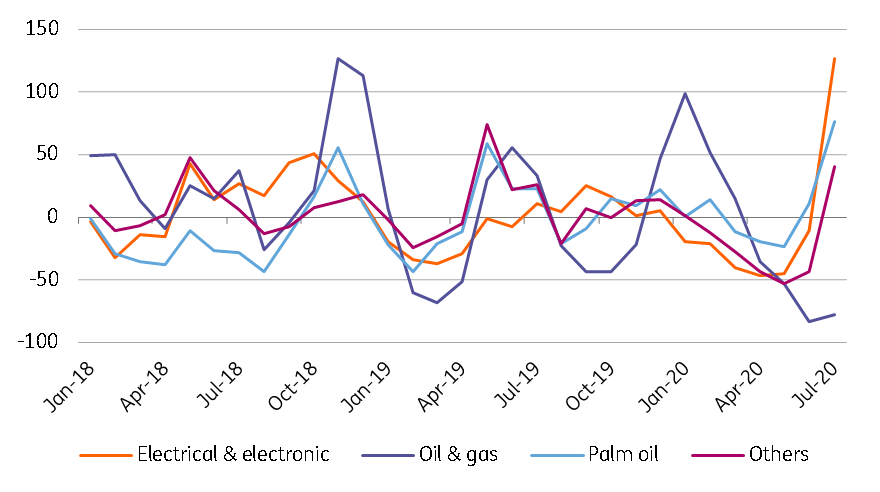
Electricals and electronics remained the key export driver with a 9.2% YoY and 21.5% MoM growth, making up more than one-third of total exports.
On the other hand, oil and gas exports still remain weak as they feel the pain of the sharp drop in global oil prices earlier this year and continued weak demand due to the pandemic. Oil and gas exports were down 21% YoY in July but were up 28% MoM. Palm oil grew 52% YoY and 1.6% MoM.
In terms of destination, shipments to the USA and China stood out with 29% YoY and 14% growth respectively.
Oil and gas remain a weak spot in exports (3m/3m, % annualised)

An all-time high trade surplus
The import slowdown accelerated to -8.7% YoY in July from -5.6% in June, lifting the monthly trade surplus to MYR 25.1 billion - a new record after the MYR 21 billion surplus seen in June. This brings the cumulative trade surplus in the seven months of 2020 to MYR 89.7 billion, which is MYR 739 billion wider than a year ago.
We maintain our view that net outflows on service account owing to stalled tourism more than offset steady trade surplus and the overall current account surplus sustain its narrowing trend over the remainder of the year. The current surplus fell to MYR 17.1 billion in the first half of 2020 from MYR 31.3 billion a year ago.
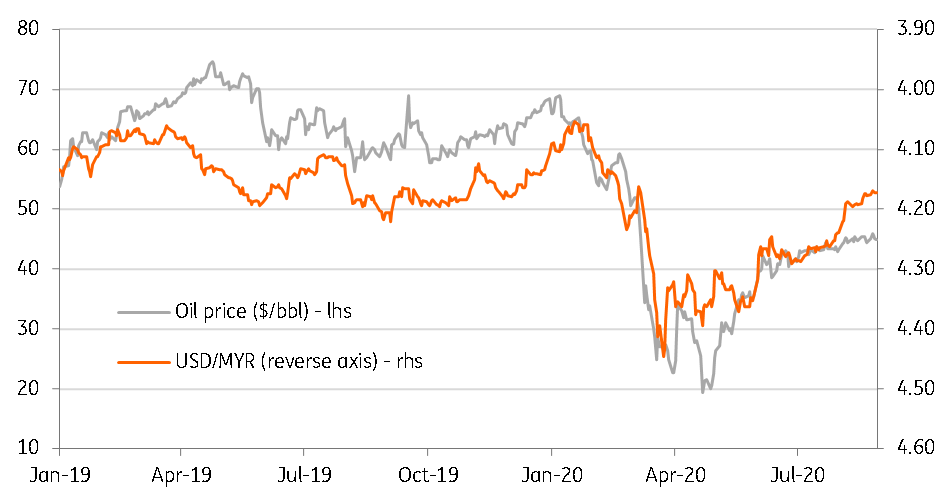
Oil price drives Malaysian ringgit

Reinforcement for the ringgit
Emerging market strength since June has helped the MYR clawback some of its losses from earlier in the year. A record trade surplus comes as further reinforcement for the MYR appreciation trend, though subdued global oil prices and narrowing current account surplus remain as headwinds to the appreciation trend. Lingering political risk given a fragile coalition government is another potential drag.
Despite recent strengthening, the MYR is still an underperforming Asian currency so far this year with 2% depreciation against the USD and is likely to remain so for the rest of 2020. That said, we are reviewing our end-2020 USD/MYR forecast of 4.18 for downward revision (spot 4.17).
This publication has been prepared by ING solely for information purposes irrespective of a particular user's means, financial situation or investment objectives. The information does not constitute investment recommendation, and nor is it investment, legal or tax advice or an offer or solicitation to purchase or sell any financial instrument. Read more
Download
Download article