$-Bloc Three commodity currencies with very different outlooks
CAD: Vanguard of the Bloc with the BoC normalising rates after trade deals in place - though new doubts are resurfacing
AUD: Laggard of the three, with stronger negative influences from China and a central bank happy to see AUD slide
NZD: Big surprise, closing the gap with AUD amid big labour market improvements and doubts about two-way policy steer from RBNZ
Commodity impact
When we talk about commodity currencies, we ought to remember that we are not talking about a homogenous group of economies. Merely ones for which commodities make up a disproportionate percentage of the total product or export basket.
For Canada, Australia and New Zealand, the differences are stark. Canada has been having a tough time as major oil pipeline constraints in the country have caused the Western Canada Select (WCS) discount to Western Texas Intermediate (WTI) to widen. With no short-term or even medium-term capacity solution in sight, there could be some further bad news for CAD-embedded in the decline in oil prices. But energy is actually now a bigger deal for Australia as a proportion of all its exports.
$-Bloc export/commodity composition
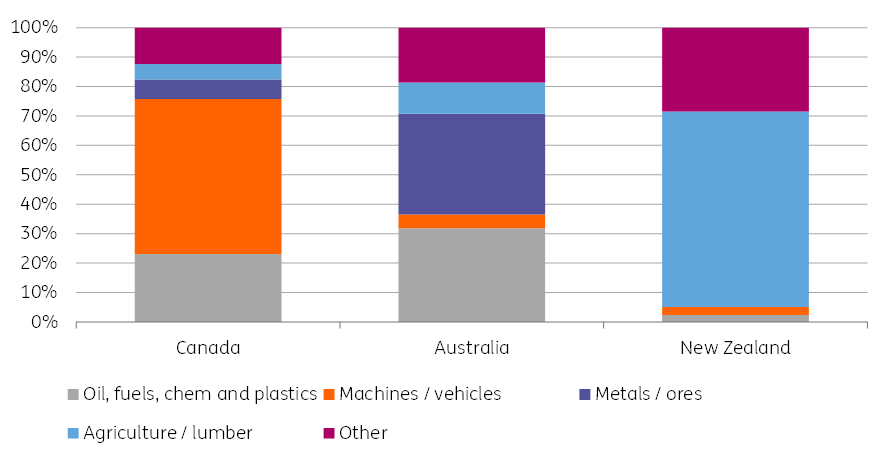
The figure above shows the top 10 export groups for each economy (which collectively account for the lion’s share of all exports) on a relative basis.
For Canada, while oil and other fuels account for more than one-fifth of this top ten group, metals a further 6-7% and agricultural output another 5%, machinery (including vehicles) accounts for more than half of this selected total. Put it another way, Canada is less of a commodity currency than either Australia or New Zealand. In contrast, the sum of commodity exports for Australia and New Zealand, viewed in this way, account for about 70% of the top ten categories, though in New Zealand’s case, this is predominantly dairy, meat and cereals (softs) whilst in Australia’s case, metals/ores and fuels account for the bulk, with agricultural output a far smaller proportion. So figuring out a common commodity thread for these economies is probably a wasted effort.
Looking for a common commodity thread for the $-bloc is a wasted effort
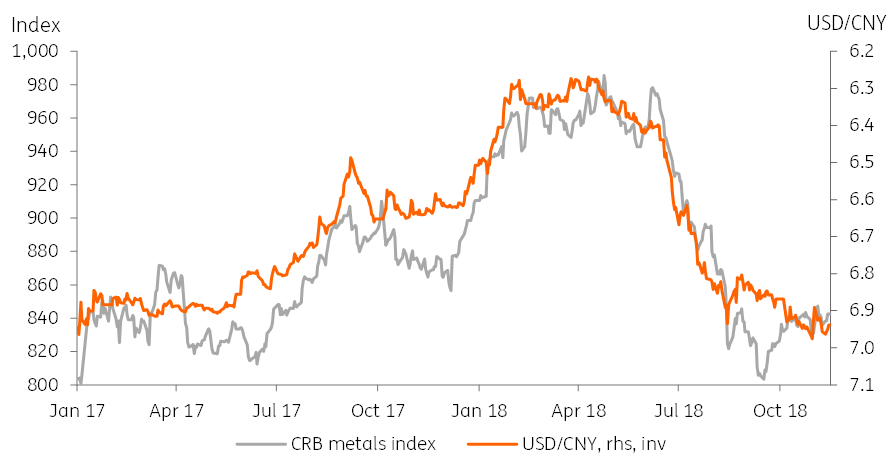
For Australia, the relevant sphere of commodity influence is China. And, for example, a plot of the CRB metals index against the inverted USD/CNY gives a particularly good fit over the past 24 months. Anticipating some further CNY weakness in 2019, we can extrapolate this to weaker metals prices and, in turn, a weaker AUD.
Metals prices and (inverted) USD/CNY
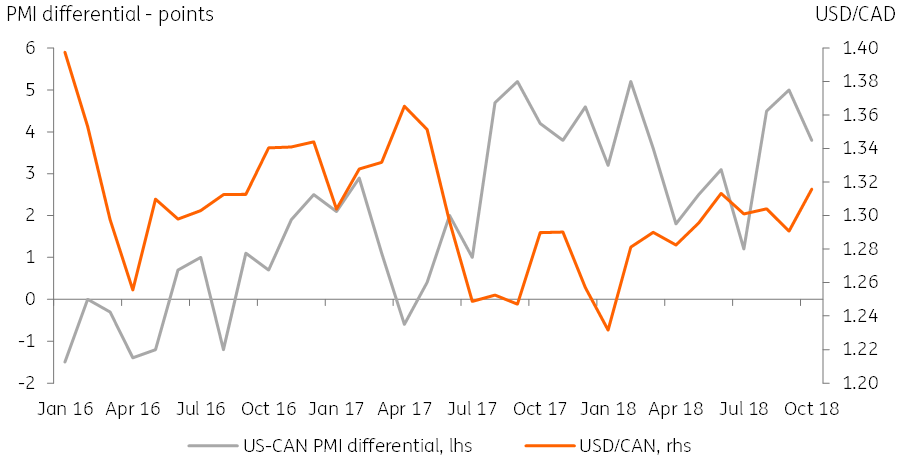
For Canada, the key metric is not a commodity at all, but the strength of the US manufacturing economy relative to that of Canada. Right now, having been extremely strong, Canadian manufacturing is picking up while in the US, it might be peaking out. That could provide some CAD support as we run through 2019.
USD/CAD and relative PMI strength
For New Zealand, the best that we can say is that softs demand will be less demand sensitive than metals or manufactured goods. On the supply side though, it is likely to be more influenced by the weather, rainfall, etc.
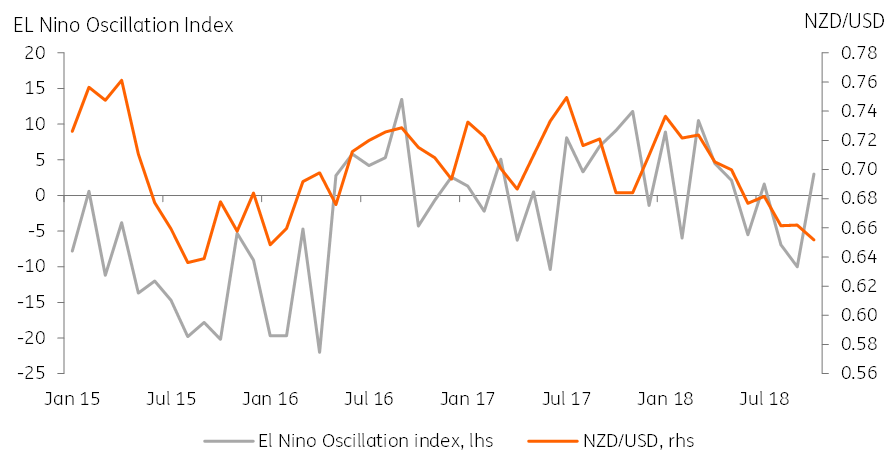
In the figure below, we show the Southern Oscillation index, a measure of the deviation of sea level air-pressure at different points in the Pacific, which drives phenomena such as El Niño and La Niña. These fluctuating weather cycles can alter mean temperature and precipitation in the southern hemisphere, by shifting the prevailing Humboldt winds and bringing more or less moisture over the land.
New Zealand’s commodity prices are as determined by the weather as they are by global demand factors
With the reading at three, the index is currently neutral, but indications are growing that an El Niño event is an increasing probability.
While this can bring drought and floods to different parts of the country, the net effect seems to be that El Niño works to weaken the NZD – higher softs prices as supply falls may be undermined by lower volumes and other factors such as low replenishment of rainfall-dependent hydro lakes and energy production.
NZD/USD and EL Niño
Canada
The Bank of Canada (BoC) is set to remain in policy normalisation mode in response to an economy operating close to potential; Canadian growth has been strong, and GDP growth should average 2.5% this year. Even with a mild slowdown forecast, growth should remain healthy – we expect 2.1% in 2019.
BoC – hiking the most of the three central banks over our forecast horizon
Our growth predictions (and thus policy rate predictions) assume some trade relief on the back of the United-States-Mexico-Canada-Agreement (USMCA) agreed in late September.
This though has yet to be formally ratified by Congress. And if this remains the case, could present a downside risk to our forecasts.
The front-runner for house majority leader, Nancy Pelosi, has already indicated that she would like to see a better agreement with regard to labour and the environment. Until Congress approves the agreement, market uncertainty will persist.
On the surface, the Canadian labour market looks good, with the unemployment rate at a four-decade low of 5.8%. But wages growth has declined for five months in a row now and may point to some hidden slack.
We do see a pick-up in wages on the horizon. Firms have recently reported labour shortages, as this is a major production capacity constraint and plan to increase hiring. This should add some upward impetus to wage growth next year, though as we have seen in the US, you can wait a very long time before that materialises.
Property market a risk in Canada, like Australia
Further downside risks reside in the housing market. And here, to some extent, the situation resembles that of Australia. Higher rates and tighter mortgage rules have lowered residential investment. Gains from house price appreciation are shrinking as house price growth cools. This could ultimately weigh enough on Canadian growth expectations to cause the BoC to alter their normalisation plans and pause earlier than expected. This would certainly limit CAD appreciation, though it remains a risk case for now.
Instead, the base case is described better by the BoC’s hawkish tone at its recent October policy meeting. The BoC signalled that it is upbeat and responding to an economy that has limited spare capacity. We see two further hikes in 1Q19 and 3Q19, respectively. This tracks slightly behind the three hikes we forecast for the Fed, which is still benefiting from the earlier fiscal boost.
We are definitely not ruling out a third hike next year, but it is hinged on downside risks subsiding - particularly on wage growth picking up and the ratification of USMCA. We see the latter as fairly likely, given the importance of the agreement for all countries involved.
USD/CAD and 2-year swap differential
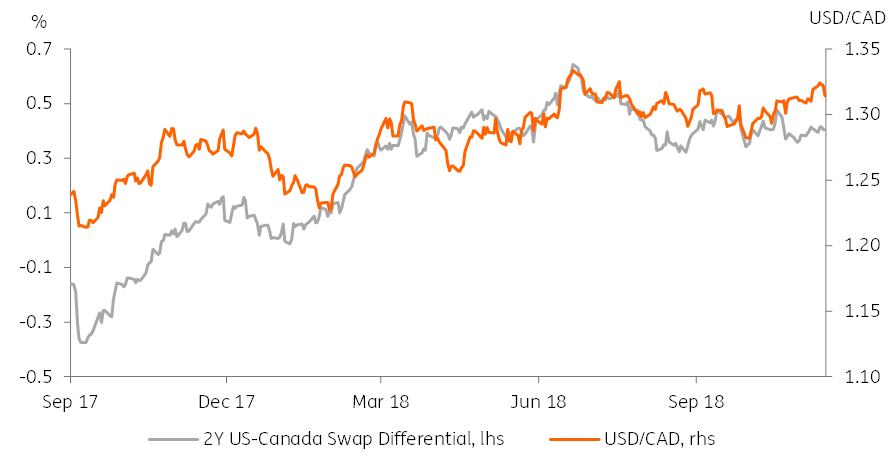
The 2-year rate differential between Canada and the US is likely to remain fairly range bound over the forecast period, though this still allows for some currency fluctuation. In particular, building expectations of a US slowdown in 2019/20 may give the CAD a slight edge over its bigger counterpart, allowing it to make some modest gains over the period.
Australia
The last time the Reserve Bank of Australia (RBA) changed policy rates, it was August 2016 and then it was to cut rates 25bp from 1.75%. Since then, the economy has given little cause for them to alter rates one way or another.
The RBA hasn’t changed rates since 2016 and that doesn't look it'll chnage any time soon
GDP growth hasn’t been too bad. Australia still holds the astonishing record of uninterrupted year-on-year growth since 4Q91. The recent pace of growth has even picked up, with the last two quarters (1Q and 2Q) coming in at over 3.0%YoY after averaging only a little more than 2% in 2017.
Mixed messages on Australian prices

The labour market too is in good shape. Strong employment growth has taken the unemployment rate down to only 5.0%, though still a little above the all-time low of 4.0% reached in 2008.
Wages growth recently began to pick up a little too, with the ex-bonus figure reaching 2.3% in 3Q18. Though still low, it hints that RBA policy won’t be on hold forever. Measures of service sector inflation might start to pick up a little. As a result, lifting headline inflation rates too, though these remain very subdued at 1.9%YoY, and some way off the mid-point of the RBA’s 2-3% inflation target. Core rates also remain subdued, and headline rates are likely to begin to ease back as oil price impacts turn from positive to negative over the months ahead.
RBA attitude to the AUD – not even benign neglect; it would like to see AUD weaker
Meanwhile, the RBA seems disinclined to suggest any imminent change to its policy, and the uncertain outlook for China reinforces that sense of caution. A positive conclusion to the US-China trade war is the most likely upside boost to the AUD in the coming quarters, though we see that as unlikely, and a sub-0.70 figure seems the more likely direction of travel.
Further downside risks include the housing market, where high levels of mortgage debt and falling home prices could not only curb household confidence spending but also spark some distress amongst Australia’s biggest mortgage lenders. Bank funding costs rose sharply in 2Q18 even without RBA tightening, and that has already been largely passed on in lending rates. Although the RBA says that the next rate move will probably be a hike, we believe there is two-way risk around this. We certainly don’t feel the RBA would be worried by a sub-0.70 AUD/USD outcome, with a far lower rate possible if downside risks to the growth and rate outlook materialise.
New Zealand: Looking better all the time
Until recently, New Zealand looked the runt of the $-Bloc, with weak growth and tepid inflation. The Reserve Bank of New Zealand (RBNZ) Governor, Adrian Orr hinted that rates could actually be cut further, not just be raised. Though like the RBA, his real message has been consistent with an expectation that rates were going nowhere fast.
New Zealand is the big positive surprise in the $-Bloc
Bank bill futures implied rates in New Zealand and Australia hint at little-expected action over the coming 24 months. Though expectations in New Zealand recently perked up as the unemployment rate in 3Q18 dropped sharply to only 3.9% (was 4.4%) and wages growth, though still subdued, also posted a surprising upwards surge of 1.4%QoQ taking ordinary time hourly wages growth up to 3.6%YoY - well ahead of wages growth in Australia. That’s not bad by historical standards, and though slower than pre-crisis rates of growth of about 5-6% in 2006-08, also looks quite good compared with non-exceptional years.
Implied rate spreads and AUD/NZD
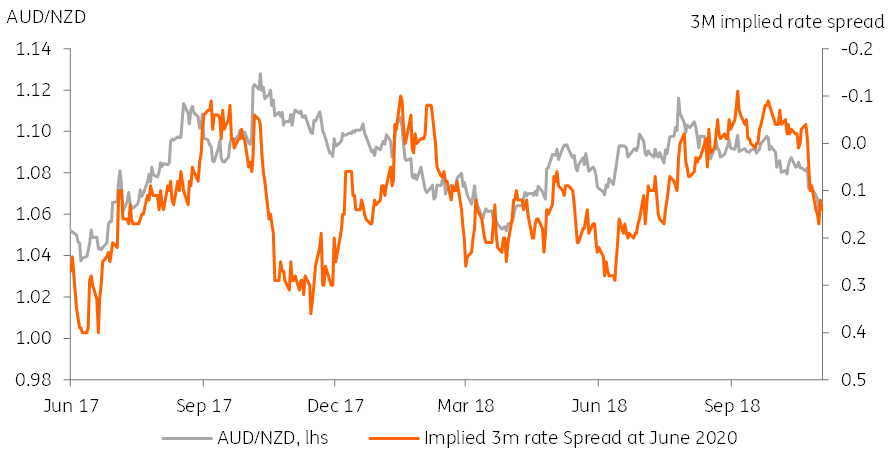
Despite the possibility of some weather related softness in New Zealand and the NZD, we suspect that the AUD/NZD cross could move closer to parity during 2019 as a result.
Download
Download articleThis publication has been prepared by ING solely for information purposes irrespective of a particular user's means, financial situation or investment objectives. The information does not constitute investment recommendation, and nor is it investment, legal or tax advice or an offer or solicitation to purchase or sell any financial instrument. Read more
