India: Mixed economic signals for the oversold rupee
The economic activity data for September released over the last couple of days provides mixed signals on inflation and the external trade gap. An oversold Indian rupee (INR) position since August provides the currency with an edge to outperform in a softer US dollar environment, though there is no lasting relief in sight due to persistently high oil prices
Mixed inflation data
September consumer price inflation of 3.8% year-on-year was yet another downside surprise, though it’s still an uptick from the 3.7% rate in August. Food prices continued to surprise. But transport has started to accelerate while most other components remained elevated, led by an 8.5% increase in utility prices.
It seems the high base-year effect is outweighing the underlying upward inflationary pressure from higher global crude prices and the weak currency. The base effect will remain in play for the rest of FY2019 (ending in March 2019), and, with the central bank's (RBI) policy driven solely by inflation, this could stave off any pressure to hike rates. However, while food has kept the headline CPI muted, inflation in all other CPI components has been on an upward trend this year (see figure).
And wholesale prices have painted a different picture to consumer prices. A spike in WPI inflation in September to 5.1% year-on-year from 4.5% in the previous month was steeper than expected. As in the CPI, food inflation continued to be low but utility inflation was in the high double-digits due to rising oil prices, which drove the headline WPI rate higher.
Higher factory gate prices will eventually be passed on to consumers.
Non-food inflation has been up

Narrower trade gap
The external trade deficit surprisingly narrowed to $14.0 billion in September from $17.4 billion in August. This was despite a sharp slowdown in export growth to -2.1% YoY, the first negative print since March, from 19.2% growth in August. But import growth also slowed to 10.5% from 25.4% on a broad-based slowdown in both oil and non-oil imports.
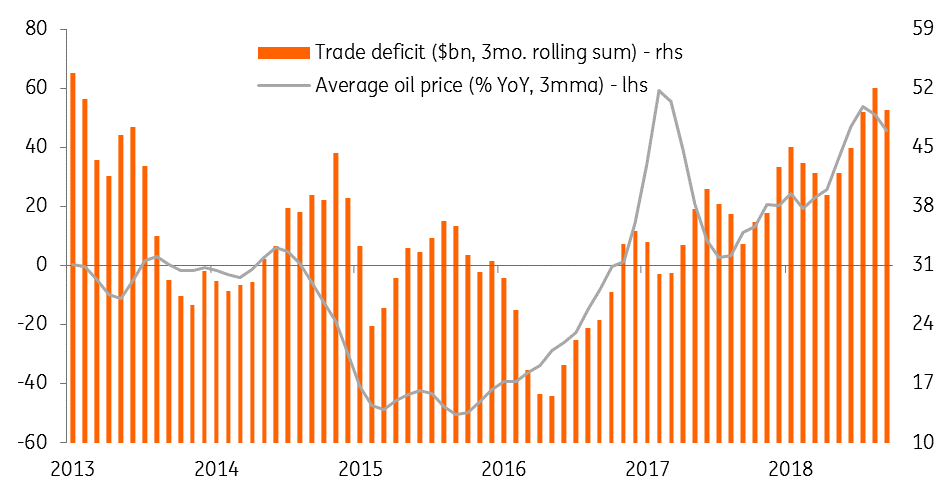
Oil imports have been falling on a month-on-month basis since July and the year-on-year growth rate has nearly halved to 34% over the same period despite firmer global crude price inflation of over 40% through September. However, after the recent spike in oil prices above $80 per barrel and with elevated geopolitical risk in gulf countries (Iran, Saudi Arabia) we anticipate no lasting relief on the trade deficit front.
The cumulative deficit of $94 billion in the first half of FY2018-19 was still $20.7 billion wider on the year, supporting our view of a widening of the current account deficit to 2.6% of GDP in the current financial year from 1.9% in the last.
Oil drives trade deficit

No lasting relief for INR
The Indian rupee's oversold position over the last two months provides it with an edge to outperform in a softer US dollar environment. Indeed, the INR stood alongside Asia’s best-performing Thai baht (THB) in last week’s global equity sell-off. However, the four-day downward USD/INR streak last week was snapped on Monday, a sign that the markets aren’t taking much comfort from the better activity data. And we aren’t yet ruling out an intensified spillover from the recent high oil price on to the INR, leaving our year-end USD/INR forecast at 76.5 (spot 73.8).
Download
Download article
17 October 2018
Good MornING Asia - 17 October 2018 This bundle contains {bundle_entries}{/bundle_entries} articles"THINK Outside" is a collection of specially commissioned content from third-party sources, such as economic think-tanks and academic institutions, that ING deems reliable and from non-research departments within ING. ING Bank N.V. ("ING") uses these sources to expand the range of opinions you can find on the THINK website. Some of these sources are not the property of or managed by ING, and therefore ING cannot always guarantee the correctness, completeness, actuality and quality of such sources, nor the availability at any given time of the data and information provided, and ING cannot accept any liability in this respect, insofar as this is permissible pursuant to the applicable laws and regulations.
This publication does not necessarily reflect the ING house view. This publication has been prepared solely for information purposes without regard to any particular user's investment objectives, financial situation, or means. The information in the publication is not an investment recommendation and it is not investment, legal or tax advice or an offer or solicitation to purchase or sell any financial instrument. Reasonable care has been taken to ensure that this publication is not untrue or misleading when published, but ING does not represent that it is accurate or complete. ING does not accept any liability for any direct, indirect or consequential loss arising from any use of this publication. Unless otherwise stated, any views, forecasts, or estimates are solely those of the author(s), as of the date of the publication and are subject to change without notice.
The distribution of this publication may be restricted by law or regulation in different jurisdictions and persons into whose possession this publication comes should inform themselves about, and observe, such restrictions.
Copyright and database rights protection exists in this report and it may not be reproduced, distributed or published by any person for any purpose without the prior express consent of ING. All rights are reserved.
ING Bank N.V. is authorised by the Dutch Central Bank and supervised by the European Central Bank (ECB), the Dutch Central Bank (DNB) and the Dutch Authority for the Financial Markets (AFM). ING Bank N.V. is incorporated in the Netherlands (Trade Register no. 33031431 Amsterdam).