First CSRD disclosures: a messy start
The initial CSRD reporting discrepancies hinder comparison. Despite that, we derive several highpoints, for example, some corporates found materiality in all ESRS topics, while none of the banks did. Improvements could be expected as reporting experience grows, but the sustainability Omnibus adds uncertainty to this messy start


First Corporate Sustainability reporting disclosures
This year marked the first Corporate Sustainability Reporting Directive (CSRD) disclosures for the 2024 financial year. The first group of entities, with more than 500 employees, had to disclose their sustainable data according to the European Sustainability Reporting Standards (ESRS). All undertakings in scope therefore disclosed information on their ESG-related impacts, risks and opportunities (IROs). Read more on the reporting requirements in our previous publications here and here.
While the current scope only requires the largest entities to disclose their information, the Directive should gradually expand to all large companies, listed SMEs and EU branches and subsidiaries of non-EU companies. However, the current discussion surrounding the Omnibus I proposal questions the mere future of the regulation. Read our full piece on the Commission’s Sustainability Omnibus proposal here.
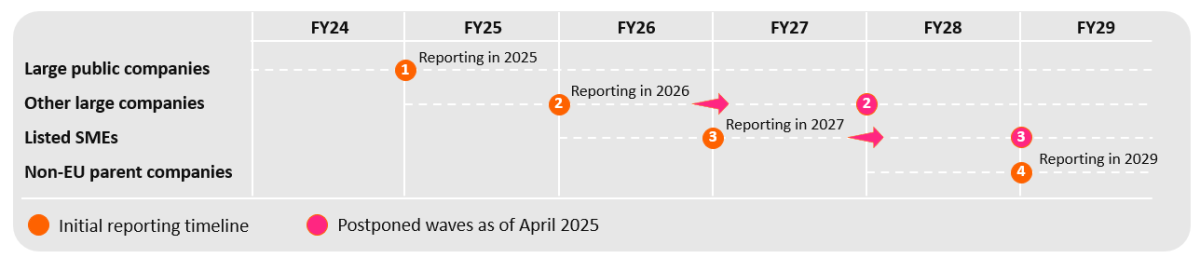
The Omnibus proposal for the CSRD includes a staggering 80% reduction in the Directive’s final scope to only include the largest corporate and financial entities. Although the legislative process is only beginning, the changes would reshuffle the number of entities required to disclose their ESG data under the CSRD. Therefore, the European legislator has already postponed the enforcement of the second and third waves of entities in scope by two years. The graph below summarises the implementation timeline of the CSRD, including the recent postponements.
Current CSRD implementation timeline
Although the CSRD's future is uncertain due to the Omnibus package, we believe examining the inaugural CSRD disclosures is worthwhile.
As a reminder, entities in scope were required to report on the materiality of 10 topics. The table below summarises and defines each topical ESRS. The next section dives into the results derived from our analysis of the first CSRD disclosures.
Topical ESRS definitions

It’s a messy start
For this first year of disclosures, we sampled 21 European banks and 20 corporates. Every entity dedicates a specific part of its annual report to its ESG disclosures. While those reports are easily accessible, the same cannot be said of the content itself. While this year’s CSRD disclosures were comprehensive, we noted significant differences in the way each institution disclosed its ESG information.
Major variations in the disclosure formats
More than 80% of banks and 90% of corporations in our benchmark presented their double materiality through a table format. Most companies opted to summarise the information in a table format and dedicated several sections to qualitatively describe the results. Despite this broad adoption of succinct materiality and IRO (impact, risk and opportunity) disclosure, the style, information and methodology differed significantly across our sample.
The content included in the table varied greatly with some banks and corporates including specifications on the materiality within the value chain, whether the IROs were expected or current and, in some cases, also the type of projection used (orderly transition, disorderly transition etc). These variations in reporting style greatly impeded the comparability of results.
A small share of entities included a scoring system to determine the level of materiality of each ESRS topic. Considering the major variation in the scaling, methodology and materiality thresholds of their scoring system, those were not comparable. Some corporates also described their plans and actions in some specific topics but without providing any clear assessment. Others provided statistics in relation to their activities and their needs (water, electricity, gas, specific materials) but only the knowledge of a specialist can judge the impact.
Overall, we observed significant variations in reporting style and formatting, making it extremely challenging to compare and understand the first CSRD disclosures. While the main reason for such differences is the absence of a common, harmonised reporting template, we also noted the wide variety of sustainable standards used by auditing firms.
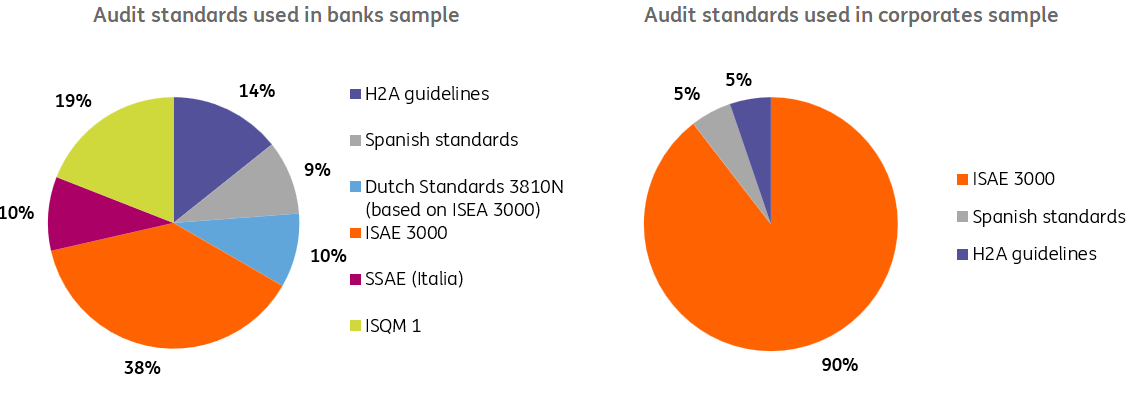
The CSRD requires all companies to have their report audited. All firms in our sample applied a limited assurance opinion, as required. The majority of those were based on ISAE 3000 standards. This is especially true for corporates, as 90% of our sample used this standard. For banks, the ratio reached only 38% of the sample. A minority of the corporates we analysed have Spanish standards and H2A guidelines.
For banks, there were national variations with six different audit standards. For example, Spanish banks were audited following the National Spanish sustainability audit standards, while Dutch banks also used a national standard based on the ISAE 3000. The graph below summarises the standards and the share each represented in our sample.
Both banks and corporates in our sample used various standards
As previously noted, the formatting, methodology, and diverse audit standards of the disclosures impeded the comparability of our sample. Nevertheless, we identified several key highlights from this first year of disclosures.
Banks' disclosures
All banks found materiality in E1, S1, S4 and G1
As mentioned above, banks were required to report on the materiality of 10 topics. On average, they reported 5.8 out of 10 topics as material. However, none of the banks in our sample classified all the topics as material. The only common point to all institutions in our sample is that they found materiality in ESRS E1, ESRS S1, ESRS S4 and ESRS G1 topics. The least materiality was reported for ESRS E3 and ESRS E2, with only three and four banks, respectively, finding the topics material.
Number of banks reporting materiality for each ESRS topic

We also note some national variations and trends in the total number of topics classified as material, as well as the types. Italian banks are the ones disclosing the most material topics, followed by their Dutch counterparts.
Aside from the number of topics classified as material in our sample of banks, we also noted variations in the number of impacts, risks and opportunities (IROs) reported in each disclosure. In total, we noted an average of 57 IROs reported in our sample. The graph below shows the nominal split between topics. It points out that the bulk of the materiality stems from banks’ social impact, more specifically regarding their own workers (ESRS S1) and their consumers and end-users (ESRS S4). We also note a high number of IROs identified for climate change (ESRS E1) and business conduct (ESRS G1).
Total number of material IROs identified per ESRS topic

Those numbers include all three variables: impacts, risks and opportunities. However, the bulk of the materiality disclosed comes from identified impacts. Identified risks are mainly reported for environmental topics, mainly stemming from the physical climate risks’ impact on banks' building portfolio (devaluation of collateral).
A large share of risks is also identified for customers (ESRS S4) with, for example, data breach concerns and privacy issues. Meanwhile, governance-related risks (ESRS G1) involve potential regulatory breaches concerning anti-bribery and Know Your Customer (KYC) requirements.
More than 56% of the impacts were classified as positive
In addition to the risks stemming from and towards ESG matters, most banks specified whether the impact identified as material was positive or negative. On average, more than 56% of the impacts are classified as positive and just below 40% as negative. However, this greatly varies between objectives, with ESRS S1 displaying the highest share of positive impact (70%) and ESRS E2 the lowest (12.5%). The high number of positive impacts identified for a bank’s own workforce mainly stems from diversity and inclusion programmes in place.
Split between positive and negative impacts reported per ESRS topic

We also noted major variations in the number of identified IROs between banks. The heatmap below summarises the results by national averages. The darker the shade, the higher the number of IROs disclosed by banks on average.
Italian institutions not only disclosed most ESRS topics as material, but also identified the highest number of IROs. This contrasts with Dutch banks, which also disclosed many topics as material, but for which only a few IROs were identified for each topic.
Number of impacts, risks and opportunities reported per ESRS topic, averaged by country

Corporates' disclosures
We established a benchmark of 20 corporations, evenly distributed across the Energy, Automotive, Telecommunications, and Utilities sectors. Initially, we reviewed 32 corporations before narrowing down our benchmark. Of these 32, 70% presented their double materiality assessment in a summary table.
In our group of 20 corporations, 18 used a table (a 90% ratio), which improved transparency and clarity for our analysis. The CSRD information was typically included in their 2024 annual reports and occasionally in dedicated ESG documents.
All corporates have disclosed one or several material impacts on climate change
Within our benchmark, the totality of the corporates provided an assessment of their negative and/or positive material impacts on the topic ESRS E1 regarding climate change. Regardless of the sector, this topic offers the best disclosure and transparency among all the topics on which companies must report.
The ESRS E1 material topic is the most reported

The topics ESRS S1 and ESRS S2 (own workforce and workers in the value chain) are also well covered, with just two companies out of 20 not reporting any information or not seeing any material impact. With a statistic of 80%, the Business Conduct topic (ESRS G1) is also well documented and assessed. Four corporates (20%) did not clearly express a positive or negative impact on ESRS G1 (Business Conduct), but mostly described the plans and actions put in place to deal with potential issues within the topic.
The 60% disclosure rate for topics ESRS E2 (Pollution) and ESRS E3 (Water and Marine Resources) indicates limited coverage or impact in these areas. Notably, none of the five telecommunications companies included in our benchmark identified these topics as material or addressed them in their sustainability reports. Telecom operators could be exposed to environmental risks related to air, water, and soil pollution, particularly through emissions from data centres, backup generators, and extensive network infrastructure.
We also studied the reporting of impacts, risks and opportunities (IROs) by the 20 corporate players in our benchmark. These assessments mostly relate to potential financial risks and opportunities. The ESRS E1 topic was again the most disclosed upon, with 95% of the corporates reporting a (potential) financial impact. Just like material impacts, the topics ESRS S1 and ESRS S2 were also well covered, with 70% of the corporates reporting a current or potential impact, either positive or negative and sometimes both.
Risk and opportunities are most present in ESRS E1 and ESRS S1/S2

The automotive and energy sectors offer the highest transparency
We conducted an analysis based on the four main sectors we chose to cover: Automotive, Energy (oil & gas), Telecommunications and Utilities. Three main observations came to mind following our analysis:
- Telecom players reported the lowest amount of material impacts, as well as financial risks and opportunities. For material impacts, 58% of the topics showed either no material impact or no communication on the assessment at all. This compares with 8% for both automotive and oil & gas companies, which we consider as the two sectors offering the highest transparency.
The sectors sampled report various amounts of material impacts
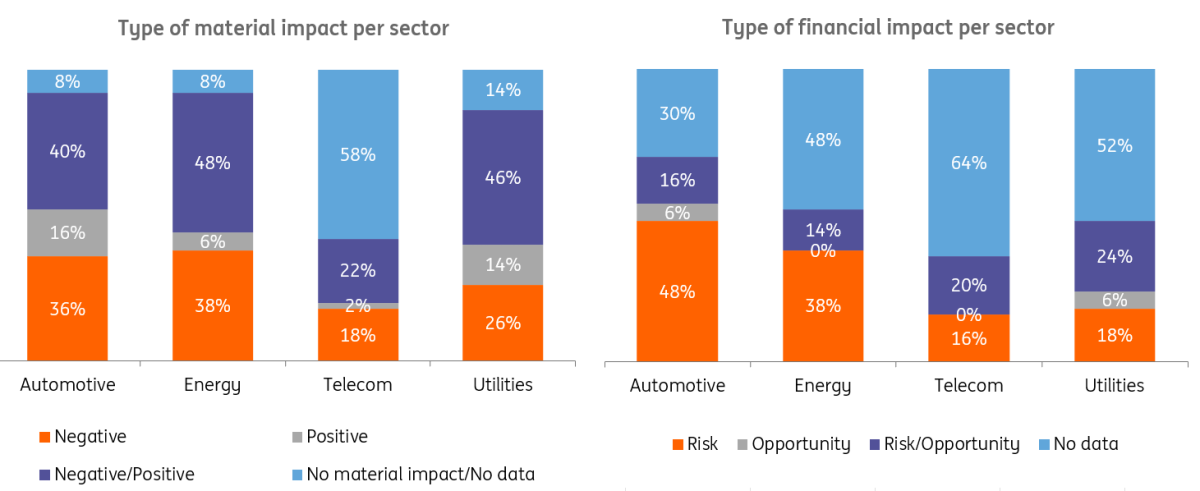
- The material impact assessment conducted by the 20 corporates on the 10 ESRS topics shows that the Energy, Utilities and Automotive sectors have between 40% and 48% of their disclosures presenting both positive and negative impacts from their activities and action plans. For instance, automotive companies flagged the negative impact of their greenhouse gas emissions, but also saw the positive impact of their electric vehicles. The largest amount of positive and negative impacts within the same ESRS main topic is to be found in the social part of the assessment (S1 to S4). Corporates identified impacts and challenges on social aspects while they also positively flagged the positive impacts of their actions and plans to deal with the issues.
- Companies are identifying more material impacts than financial ones in their CSRD disclosures, indicating that even if impacts can be seen as significant, they are not immediately tied to financial risks or opportunities.
Putting aside the complexity of comparing each entity’s disclosures due to the lack of harmonisation in the reporting, some trends can be highlighted from this first year of CSRD disclosures. The next section is therefore diving into the main conclusions that can be drawn from the analysis.
Significant variations across institutions
Even if the comparison of the first CSRD disclosures proved to be an arduous task due to the overall messy reporting, we were able to derive several key points.
First, all financial institutions in our sample found four ESRS topics material: E1, S1, S4 and G1. However, none of them found materiality in all 10 topics. This contrasts with our sample of corporates in which 20% (five entities) identified all 10 ESRS topics as material. We also found that all corporates reported materiality in ESRS E1, S1 and S2.
Second, the number and nature of identified IROs varied significantly between entities. This is true for both banks and corporates. Indeed, some undertakings disclosed materiality but reported only one or two IROs while others found and disclosed dozens of examples.
These two points add to the reporting style differences as well as the auditing discrepancies we noted earlier. In summary, the use and comparison of CSRD disclosures are significantly hampered by the lack of harmonisation between reports. That being said, it is worth keeping in mind that these disclosures were the first ones. Both banks and corporates are still building experience in gathering their CSRD information and ESRS data.
One could hope that CSRD disclosures make the same improvement as the European Taxonomy did, with a significant increase in comparability through the use of harmonised templates. However, the Omnibus I package may throw a bit of a spanner in the works on the reporting progress. In February 2025, the European Commission published its proposal to merge and streamline sustainable reporting directives, including the CSRD. It shows a clear willingness to significantly cut the number of entities subject to sustainability-related reporting requirements.
While reducing the number of entities in the scope of the CSRD by 80% would lift the regulatory burden for most corporates, it would imply several significant challenges for financial institutions (at least those still in the scope of the CSRD). Aside from this issue, a possible improvement could stem from the reduction of ESRS data points to collect. Nonetheless, this would only be done through a Delegated Act and once the Omnibus package is adopted. Time will therefore tell if improvements stem from this regulatory change. In the meantime, read more on the Omnibus proposal and its implications for the banking sector in our piece here.
We would like to thank Nicolas Bousquet for his precious help regarding this publication
Annex
Sample of entities included in the benchmark

This publication has been prepared by ING solely for information purposes irrespective of a particular user's means, financial situation or investment objectives. The information does not constitute investment recommendation, and nor is it investment, legal or tax advice or an offer or solicitation to purchase or sell any financial instrument. Read more
Download
Download article