Turkey’s Yapi Kredi still short of capital
Yapi Kredi continued the theme we have seen from Turkish banks so far, reporting very strong FY17 profitability. But although its metrics lag its peers’, they remains sound and are very strong for a bank in the BB category
Results Highlights
- Yapi Kredi continued the theme we have seen from the Turkish banks so far of reporting very strong FY17 profitability (net income +33% YoY to TRY3.6bn), driven by TRY loan growth (+13% YoY) and strong NIM management (up 10bp YoY to 3.1%).
- The headline loans/deposits ratio (LDR) also held up nicely at 115%, which is stronger than the sector average of 120%. In TRY, this ratio stood at a stretched 166%, while the FX ratio was very healthy at 76%. While we have also observed stretched TRY LDRs at Yapi Kredi's peers. Yapi Kredi's imbalance is more pronounced than peers’ and has not yet begun to recover, unlike most of its competitors.
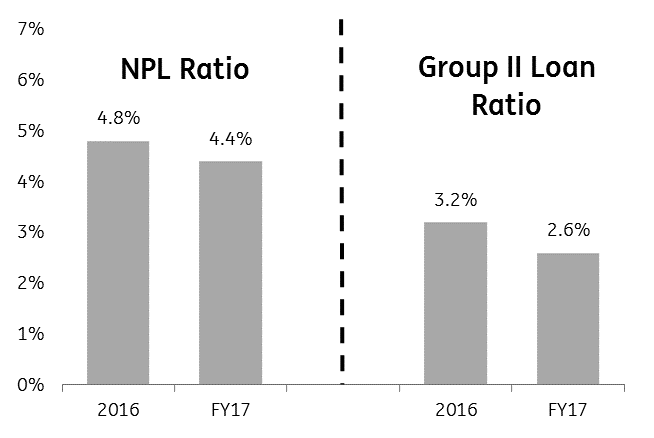
- Asset quality and capitalisation also strengthened. For the former, we observe that the NPL ratio fell by 40bp YoY to 4.4%, though this is still weaker than the sector average of 3.0%, while the Group II loans add another 2.6% of impairment (-60bp YoY). The coverage ratio of 114% is fine but lower than most private-banking peers'.
- More seriously, while headline CAR is robust at 14.5% (+30bp YoY), the bank's CET1 ratio stood at 10.9% at end-FY17 (or just 10.0% on a consolidated Group basis), which is lower than its peer group, most of whom have Tier 1 ratios approaching 14%.
- For 2018, Yapi Kredi expects loan and deposit growth of 12-14%, flattish NIM and a modest reduction in the NPL ratio (-10bp). The LDR should stay in the 110-115% range, while the target for CAR is >13%.
Earnings in detail
- Yapi Kredi’s FY17 net profit increased by 33% YoY to TRY3.6bn, supported by strong revenue growth. In particular, net interest income rose 18% YoY to TRY9.7bn. While swap-adjusted NIM fell 20bp YoY to 3.1%, lending grew nicely (+13% YoY) to TRY 200bn; it was heavily focused on TRY lending (+19%) against FX (-2%). Net interest income makes up 71% of YKBNK’s revenues. Fees & Commissions, which account for 24% of revenues, rose 12% YoY to TRY3.3bn. Expenses are well under control. While total revenues rose 11% YoY to TRY13.8bn, operating costs increased just 9% YoY to TRY5.8bn. Consequently, the cost/income ratio strengthened from 42.8% to 41.3% over the period.
Yapi Kredi's asset quality development (FY17)

- Yapi Kredi’s provisioning charge of TRY3.4bn fell 6% YoY, suggesting that asset quality is continuing to improve. This equates to a cost of risk of 107bp, down from 137bp in FY16. The specific cost of risk also declined from 110bp to 92bp over the period. Bringing all this together, YKBNK achieved ROAA of 1.2% in FY17, up 14bp YoY. ROATE increased from 11.9% to 13.6% over the period.
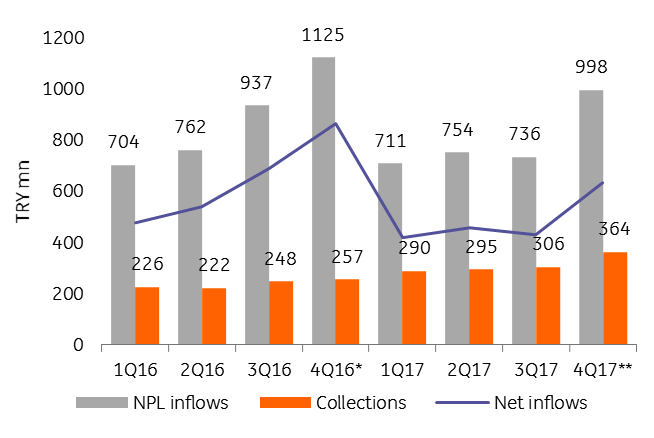
- Yapi Kredi’s TRY200bn loan book is of reasonable quality, though markedly weaker than peers’, as demonstrated by the NPL ratio of 4.4%, down 0.4ppts YoY but well above the sector average of 3.0%. The fall in the NPL ratio was mainly due to a slowdown in NPL inflows, which we have observed across the sector and the impact of TRY 1.6bn of NPL sales in FY17. Increased collections in Q4 also went some way to offsetting the addition of “big-ticket NPLs”, which we take to refer to the Otas loan. More encouragingly, YKBNK boasts a healthy coverage ratio of 114%, up modestly this year, which was split into 77% of Specific Provisions and 37% of Generic Provisions. In addition to the NPLs, YKBNK has a Restructured Loan ratio of 1.1%, down 30bp YoY, and a separate Watch List Loan ratio of 1.5% (down 30bp YoY). Total impaired loans, therefore, stand at 7.0% of total loans.
Yapi Kredi's - NPL flows

- Yapi Kredi had US$19.6bn of FX loans outstanding at end-FY17 (-2% YoY), equating to 37% of total loans. All these exposures are in the Companies segment, which gives us some comfort. These exposures are offset by US$25.8bn of FX deposits (+25% YoY).
- Yapi Kredi has a solid liquidity profile. Deposits make up 54% of liabilities, with borrowings comprising another 24%. 56% of deposits are denominated in FX, as opposed to just 37% of loans. The loans/deposits ratio of 114% represents only a modest decline (+2ppts YoY) and is better than the sector average of 120%. The bank is looking to reduce this further over time, particularly in TRY, where it has been stretched to 166% by the lending surge of 1H17, which was generated by the Credit Guarantee Fund.
- Borrowings are well diversified. The bank boasts US$2.8bn of syndications, US$2.6bn of subordinated loans (of which just over $1bn were contributed by UniCredit), US$2.7bn of Eurobonds and TRY529m of covered bonds. The bank also boasts TRY1.8bn of local-currency bonds and bills.
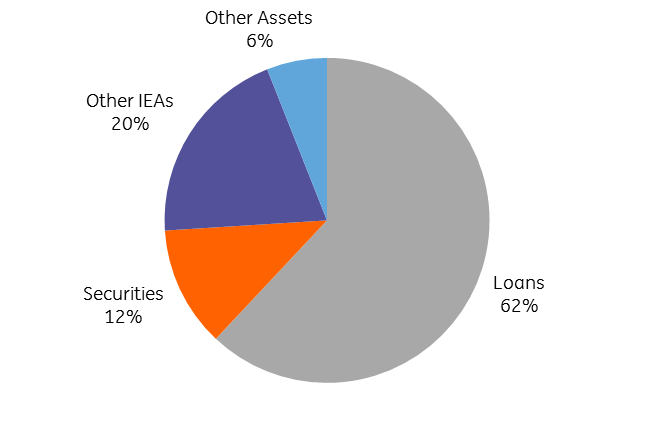
Yapi Kredi - Asset mix

- Securities make up just 12% of assets, up marginally YoY and low compared to historic levels. Of the TRY 39bn of securities on YKBNK’s balance sheet, 29% are denominated in FX.
- YKBNK has a decent capital position although it lags domestic peers, posting a capital adequacy ratio of 14.5% and a CET1 ratio of 10.9% in FY17 on a Bank-Only basis. The latter represented a 30bp YoY improvement due to retained earnings and the capital relief granted to CGF loans, which are 0% risk weighted. On a consolidated basis, the CET1 ratio was just 10.0%.
Guidance for 2018
Yapi Kredi expects both loans and deposits to increase by 12-14% in FY17, continuing the theme of new lending being largely deposit-funded. NIM should be flattish, with the Cost of Risk and the NPL ratio both expected to fall marginally, with new NPL inflows expected to decline and NPL sales to continue. The loans/deposits ratio should also remain stable at 110-115%, though our focus will be on the TRY number rather than the headline figure. The target for CAR is >13%, which is not overly ambitious, given the starting point of 14.5%.
Overall, the guidance fits in with the picture of a steady, unspectacular year, which fits well with what we have seen from the other private banks so far.
This publication has been prepared by ING solely for information purposes irrespective of a particular user's means, financial situation or investment objectives. The information does not constitute investment recommendation, and nor is it investment, legal or tax advice or an offer or solicitation to purchase or sell any financial instrument. Read more
Download
Download article