EM Sovereign Credit: Vulnerabilities from external financing conditions
- 15 July 2021
- Bulgaria Croatia
In the near-term, emerging sovereign credit benefits from favourable external tailwinds and official support. However, with dollar financing conditions likely to tighten by early 2022, we assess EM external vulnerabilities based on our heatmaps. We find that vulnerabilities are largely confined to frontier markets but there are mitigating factors


Please note that this is the non-investment research version and does not include the investment strategies contained in the Global Markets Research version of the report.
Strengthening economic recovery prospects and loose monetary policy have fuelled US$180bn of portfolio flows into EM debt over 1H21, according to the Institute of International Finance (IIF). Those favourable tailwinds, plus support by official lenders and access to capital markets, have allowed EM central banks to build up their war chest over the last year, with FX reserves rising for most.
FX reserve change (% YoY) and latest FX reserves (% of GDP)
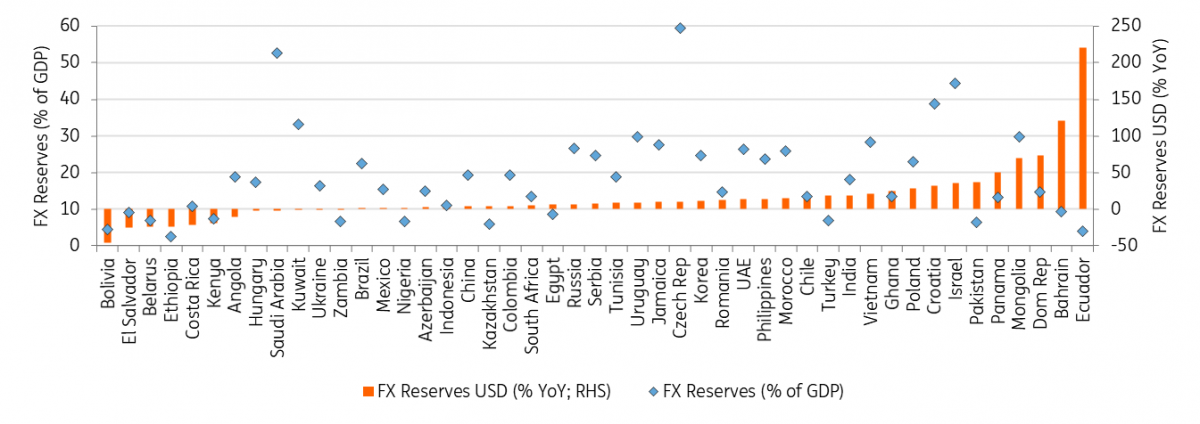
This setting is likely to prevail over the next few months as terms of trade remain favourable, the emerging market vs developed market rates differential is growing, and the IMF will create a US$650bn SDR allocation subject to Board of Governors approval expected by August.
However, with the Fed dot plot now pointing to 50bp of hikes by 2023 and the discussion on QE tapering out in the air, this should ring some alarm bells. We expect that dollar funding conditions will be tested by early 2022 when rate hikes come into view and the marginal availability of dollar liquidity shrinks.
EM risk assets look particularly vulnerable from a reversal in portfolio flows and spread performance that we have seen over the last year: This would also come at a time when current accounts come off from a position of strength and debt refinancing needs are high. The fallout will depend on the pace of expected tightening and vary for individual issuers as we discuss in this note and can be seen in the heatmaps.
All in all, a large part of Asia, higher rated CEEMEA economies, and commodity exporters are more resilient from a turn in external sentiment. Vulnerabilities are largely confined to frontier markets, especially for countries that run large structural current account deficits and face a high external debt service burden (particularly from commercial debt) against insufficient FX reserves. However, fiscal and monetary policy track records, reform anchors such as IMF programmes, political cycles and proactive liability management can mitigate or exacerbate external vulnerabilities.
Global dollar conditions: As easy as can be but the turning point is near
It may seem odd to talk about a tightening of external financing conditions, in particular in US dollars, when these are getting easier by the day, but this is a risk global markets contemplate within a 12- to 18-month horizon.
At present, through the purchase of US$120bn of asset per months, and as the US Treasury runs down its account at the Fed to provide stimulus to the economy, dollar liquidity supply is rising faster than demand. There is thus a rising availability of dollar financing, created by the Fed and made available to economic agents through an array of emergency measures put in place by central banks (eg currency swap lines).
Further up the yield curve and down the credit spectrum, some of this extra liquidity is used to chase returns in higher-risk investments. By the same token, the funding premium commanded by the US dollar against an array of other currencies in cross currency swap markets is melting away.
So, what ground do we have for ringing the alarm bells at this stage of the cycle? The additional US$120bn of bank reserves created by the Fed through QE will be tapered down to nothing by the end of 2022 at the latest.
There is also the fact that the turning point in the availability of dollar liquidity will be a prelude to rising US rates. In fact, a certain number of Fed hikes starting in late 2022 is priced into the US yield curve, but we argue that path is far too shallow compared to the outlook for the US economy.
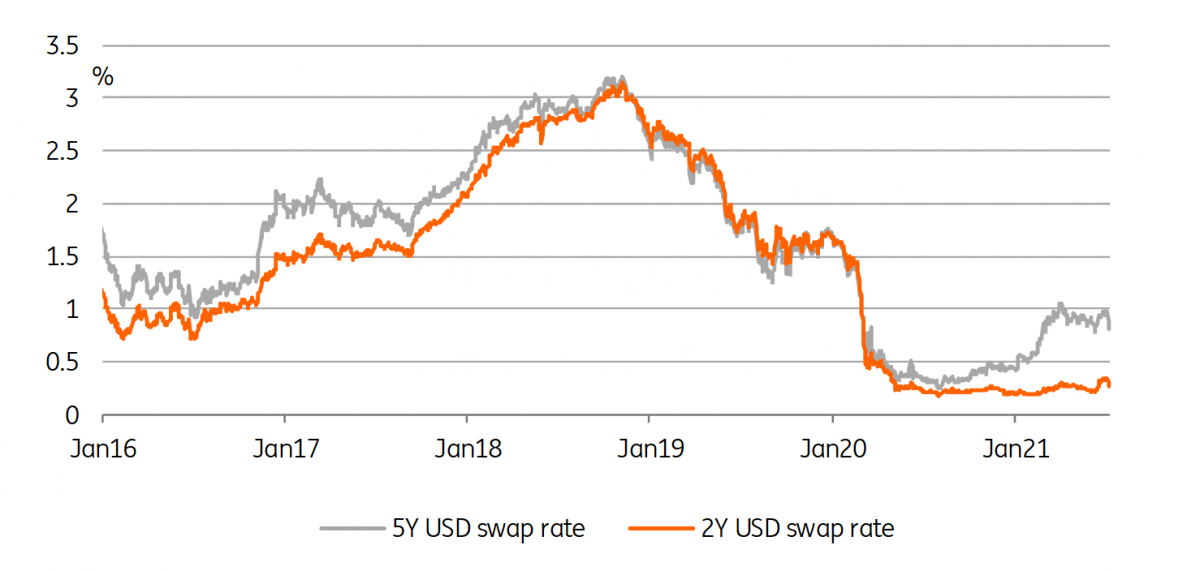
So how will we get from here to there? We expect intermediate rates to rise first, before the end of the year. These are rates most directly affected by Fed hikes, roughly speaking the 2-5Y part of the curve. Shorter rates should remain contained for at least another 6 months, as liquidity will continue increasing for the whole of this year.
Starting in 2022, these short-dated rates will start rising due to both hikes coming into view within one year, and as the marginal availability of dollar liquidity will shrink. From this point onwards, the 2-5Y part of the curve should start to flatten further and will eventually invert. We are also likely to see a widening of credit spreads in US money markets, for instance Libor-OIS spreads, and a re-widening of the cross-currency bases against the dollar.
Look for 2s5s to invert when the Fed hikes
Limited near-term risks from current account imbalances but large deficits and low FX reserves weigh on some beyond 2021
For our analysis, we primarily use data from the IMF World Economic Outlook from April 2021 (WEO) for projections on GDP and current account balance and International Financial Statistics (IFS) for the FX reserves.
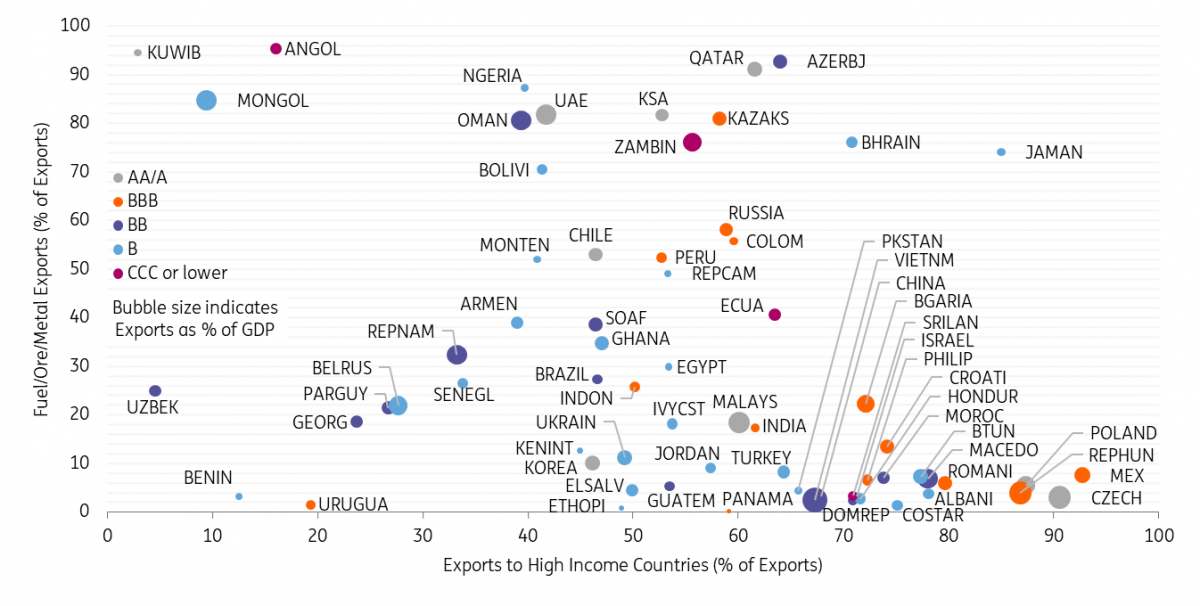
Current balance dynamics for 2021 remain supportive owing to higher exports and commodity prices: Most larger EMs that used to run deficits in pre-pandemic years are set to report small deficits with some remaining in surplus this year (eg, Mexico, Peru, the Philippines and South Africa), based on Bloomberg consensus and/or the IMF projections. Beyond those, commodity producers (including most GCC and CIS economies, Angola, Cameroon, Ecuador, Gabon, Mongolia and Nigeria) and countries with a large export share to high income countries (Central America, CEE, China and SE Asia) benefit from higher export prices and/or volumes.
Exports to high income countries and commodity exports (% of total exports)
Large current account deficits in a handful of EMs in 2021 pose limited near-term concerns: foreign direct investment fully or largely covers substantial deficits in Mongolia (11.8% of GDP C/A deficit based on IMF projections), Albania (8.7%) and Serbia (5.7%), and around half of the deficits in Montenegro (18.7%) and Uzbekistan (6.4%). Romania (5.0%) benefits from access to EU funds. Deficits in Senegal (12.8%), Georgia (11.5%), Jordan (8.3%), Armenia (6.7%), Kenya (5.3%) are largely financed by a mix of bilateral and multilateral funding, with IMF programmes serving as an anchor. In addition, most of the above-mentioned countries and Oman (6.4%) are relying on Eurobond issuance this year. An IMF programme is also being discussed for Tunisia (9.5%). On top of official funding, the IMF’s Special Drawing Rights (SDR) allocation of US$650bn.
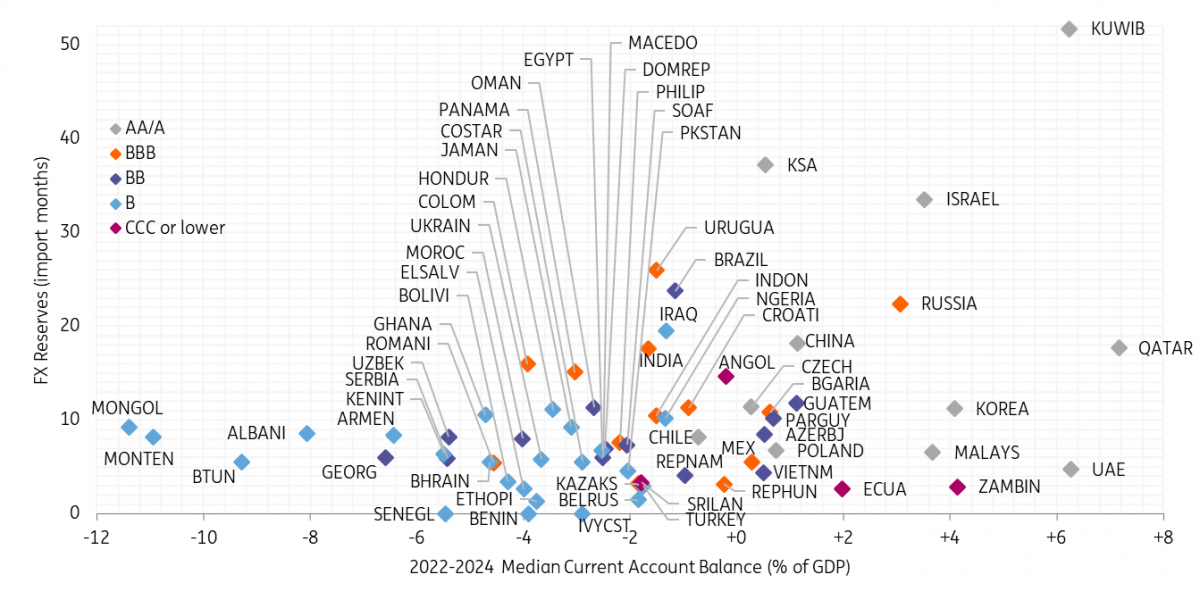
We are more concerned on the outlook for the years ahead when a reversal in current account balance dynamics could meet a more hawkish Fed in tapering mode. Based on the IMF projections and Bloomberg consensus, the aggregate EM current account is set to reverse the improvement over the last two years. In the chart below, the X-axis shows the 2022-24 median C/A balance for individual EMs (based on IMF projections).
- Countries best positioned can be found in Asia (South Korea, Malaysia, China and Vietnam), among commodity producers (Qatar, UAE, Kuwait, Zambia, Russia, Ecuador, Saudi Arabia, Azerbaijan, Gabon and Angola) and the better-rated CEEMEA sovereigns (Slovenia, Israel, Lithuania, Poland, Bulgaria, Czech Republic, Hungary, Estonia, Latvia and Croatia). We find a more balanced picture in LATAM with surpluses in Guatemala, Paraguay and Mexico, modest deficits in Chile, Peru and Brazil, but somewhat larger deficits (~3% of GDP or higher) in Bolivia, El Salvador, Colombia, Honduras, Jamaica, Panama and Costa Rica.
- The fragile five of 2013 are expected to run only modest median deficits between 2022-24 which should limit external vulnerabilities there (between 1.2% of GDP for Brazil and 2.1% for South Africa, with India, Indonesia and Turkey in between that range, based on IMF projections).
-
The weakest links are frontier market sovereigns that continue to run large deficits in the years ahead: Deficit projections are most alarming in the previously mentioned Mongolia, Montenegro, Tunisia, Albania, Georgia, Armenia, Kenya, Senegal, Serbia and Uzbekistan (all above 5% of GDP). Others with large deficits (3.5-5% of GDP) include Ghana, Bahrain, Bolivia, El Salvador, Benin, Ethiopia and Ukraine. Among the BBB-/BB+ rated names, Romania (4.6% of GDP deficit), Morocco (4.0%) and Colombia (3.9%) have weak external balances. Persistent large structural C/A deficits have already contributed to a significant external debt burden and need to be addressed: External debt has surged beyond 100% of GDP in Bahrain (253% in end-2020; Moody’s), Mongolia (245%), Montenegro (217%; Moody’s), Georgia (129%), Armenia (105%) and Tunisia (104%). Positively, some benefit from stable funding sources such as EU funding or FDI (particularly Albania, Ghana, Mongolia, Romania, Serbia and Ukraine, to a lesser extent Colombia, Georgia, Montenegro, Senegal and Uzbekistan) which lowers balance of payments risks. For countries that rely on capital markets, those with credible policies, a structural reform track record and/or an IMF programme serving as an anchor are more likely to retain access if financing conditions worsen.
When it comes to lines of defence, we primarily look at FX reserve import coverage (Y-axis in chart below). Focusing on the sovereigns with large deficits mentioned above, we sort those from lowest to highest in terms of FX reserve import coverage: Ethiopia (1 month), El Salvador (3 months), Bolivia (3), Romania (5), Bahrain (6), Tunisia (6), Ukraine (6), Serbia (6), Georgia (6), Kenya (6), Morocco (8), Uzbekistan (8), Montenegro (8), Armenia (8), Albania (9), Mongolia (9), Ghana (11) and Colombia (16). Some countries have additional tools available, with Colombia having access to a US$17.6bn IMF Flexible Credit Line (FCL, unused portion of US$12.3bn). Albania, Romania and Serbia have repo lines with the ECB until March 2022 (€400m, €4.5bn and €1bn, respectively). Benin and Senegal benefit from the pooled FX reserves of the West African Economic and Monetary Union (WAEMU), with a convertibility guarantee from the French Treasury.
IMF projections for C/A balances in 2022-24 median (% of GDP) vs FX reserve import coverage (months)
External debt structure matters when looking at risks from debt amortisation
For this exercise, we primarily use data from the World Bank’s International Debt Statistics (IDS) which provides estimates for annual external debt service for low- and middle-income countries. We also refer to calculations from rating agencies where data is not available from the World Bank or as an additional resource.
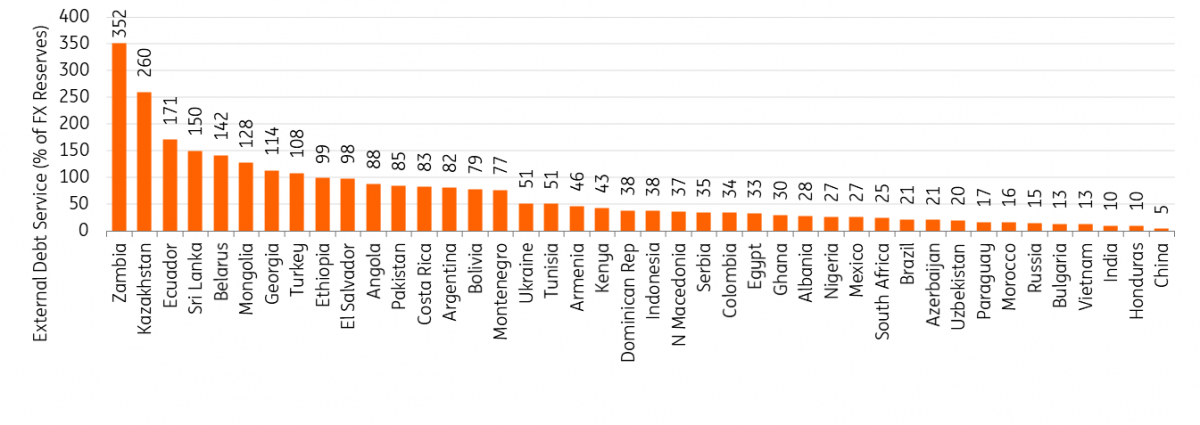
In the chart below, we put the 2021 debt service projections in relationship to FX reserves (from the IMF International Financial Statistics; IFS), excluding the expected IMF SDR allocation. External vulnerabilities are high for countries where the debt burden surpasses FX reserves (>100%). This is the case for Zambia (352%), Kazakhstan (260% although this doesn’t include sovereign wealth assets), Ecuador (171%), Sri Lanka (150%), Belarus (142%), Mongolia (128%), Georgia (114%) and Turkey (108%). Thereof, Zambia and Ecuador defaulted last year, with the former having announced its intention to restructure its Eurobonds and use the G20 Common Framework for Debt Treatment while the latter already successfully restructured last year.
2021 external debt service (% of current FX reserves)
We now shift the focus towards the total external debt stock in 2019 (rather than the projected external debt service in 2021), the latest available from the World Bank’s IDS database. For better comparability, only countries with a ratio above 40% from the chart above are shown (up to Kenya). The bars reflect the percentage share of external debt by creditor (multilateral / bilateral / bonds / banks & others) and debtor (public and public guaranteed / PPG and private non-guaranteed debt / PNG). The numbers at the top of each bar show the percentage share of concessional debt (not available for Belarus). Lastly, the green marker indicates external debt as a percentage of 2019’s GDP.
2019 external debt stock by creditor and debtor (% of total) and total external debt (% of GDP)
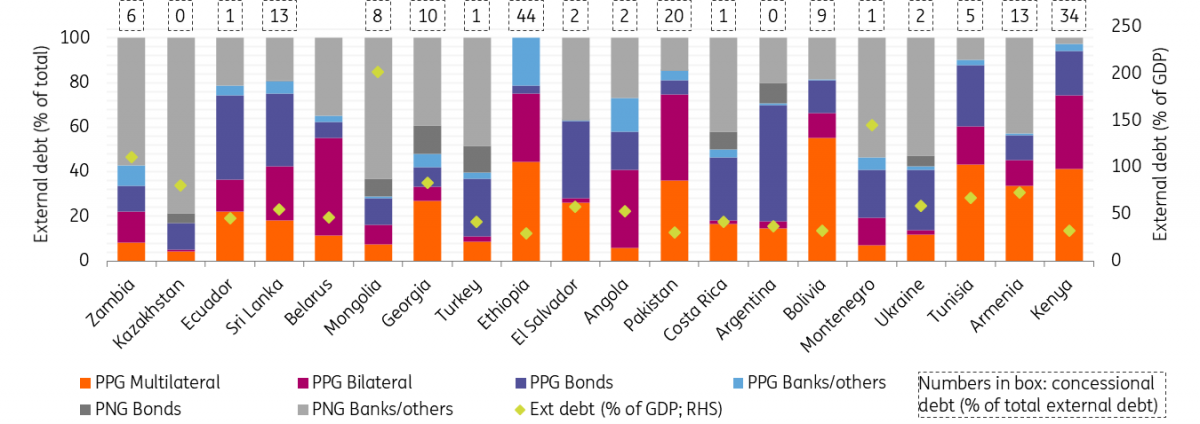
Generally, we consider commercial bonds as riskier due to the higher sensitivity to market developments, meaning that rolling over maturities will depend on access to capital markets which remains challenging or has deteriorated for the likes of Zambia, Ecuador, Sri Lanka, Belarus, Ethiopia, El Salvador, Argentina and Tunisia, mainly due to fiscal concerns, governance and geopolitics but exacerbated by external fragilities.
- Focusing on public and public guaranteed debt only, the percentage share of commercial bonds in 2019 was highest in Argentina (US$87bn/74% of total PPG debt), Kazakhstan (US$17bn/69%), Turkey (US$82bn/66%), Ukraine (US$24bn/64%), Jamaica (US$6bn/62%), Costa Rica (US$8bn/57%), El Salvador (US$5bn/55%), Ecuador (US$18bn/48%), Montenegro (US$2bn/47%), Mongolia (US$3bn/42%), Sri Lanka (US$15bn/41%) and Ghana (US$8bn/39%).
- Among the countries in focus, only a handful of countries have meaningful (private non-guaranteed) corporate bond exposure, those being Turkey (US$38bn), Argentina (US$15bn), Kazakhstan (US$6bn), Ukraine (US$4bn), Mongolia (US$2bn), Costa Rica (US$2bn), Georgia (US$2bn) and Jamaica (US$2bn).
- Multilateral and bilateral lending (both also referred to as official lending) is less market sensitive but often contingent on reforms or linked to specific projects. As such, we would focus on future reform prospects and governance aspects. Importantly, official lending arrangements can unlock or facilitate capital market access. As can be seen in our heatmap, many low income countries have arrangements with the IMF which have paved the way for commercial bond issuance. A handful of fundamentally stronger sovereigns have access to credit or liquidity lines with the IMF.
Official support mitigates near-term risks while prudent policies, reform prospects and liability management are key beyond 2021
We are most concerned about countries that run large structural current account deficits and face a high external debt service burden (particularly from commercial debt) against insufficient FX reserves. In this context, a large part of Asia, higher rated CEEMEA economies, and commodity exporters are more resilient from a turn in external sentiment while the largest risks are found in frontier markets.
For 2021 and into early 2022, risks are mitigated by a strong willingness from bilateral and multilateral lenders to extend support. As can be seen in our heatmaps, the IMF SDR allocation will deliver a substantial improvement in terms of coverage of external financing needs. Among them, Zambia’s external financing needs/FX reserves ratio for 2021 will fall from 252% pre-SDR to 122% post-SDR while Pakistan and Tunisia will fall below the 100% threshold (109% to 94% and 102% to 93%, respectively). Risks would decrease further if high-income countries decide to on-lend or reallocate their SDR allocations to low- and middle-income countries.
From our analysis, we also find that a strong reform track record of prudent fiscal and monetary policies substantially reduces vulnerabilities. Where these are non-existent, IMF programmes play a key role in anchoring market confidence as has been the case for Egypt and Pakistan in recent years. However, IMF dependency has often been a source of uncertainty when perception of reform implementation prospects is waning. Political cycles pose additional opportunities and risks as has been the case for LATAM this year, with revived optimism in Ecuador and rising concerns in El Salvador if we stick to frontier markets.
Governments can address external vulnerabilities by smoothing and extending their maturity profile through proactive liability management (eg, Mongolia in 2020 and 2021). Naturally, willingness to pay remains a concern in some cases. In this context, the G20 Common Framework for Debt Treatments (G20 CF) is a double-edged sword for bondholders as it improves debt sustainability but might result in a requirement to participate in debt relief (G20 CF participants include Ethiopia and Zambia).
The still supportive backdrop and forthcoming official support (notably SDR allocations and upside risk if high income countries decide to reallocate theirs) provides further tailwinds for higher yielding EM sovereign debt. However, with risks arising from the developed market monetary policy setting and EM sovereign spreads relatively rich, credit selection should focus on external and fiscal debt vulnerabilities. Focusing on external risks, strong DM growth and higher commodity prices favours sovereigns with a high export content thereto and thereof (see chart further above). Moreover, we prefer sovereigns with reform prospects underpinned by ongoing or prospective IMF programmes.
Content Disclaimer
This publication has been prepared by ING solely for information purposes irrespective of a particular user's means, financial situation or investment objectives. The information does not constitute investment recommendation, and nor is it investment, legal or tax advice or an offer or solicitation to purchase or sell any financial instrument.Read more