Coronavirus: Gauging the market fall-out
Risk aversion has hit asset markets as the world reacts to news of the coronavirus. Uncertainty stands to demand a further risk premium of assets exposed to Chinese demand. That probably means interest rates stay lower for longer. China-intensive commodities stay under pressure and the re-rating story for commodity-linked currencies is postponed
Parallels to SARS?
Ever since 7 January, when Chinese authorities confirmed that they had identified a new virus, global financial markets have increasingly taken notice of the coronavirus. This follows the US-Iran conflict and further threatens to undermine what was expected to be a gradual rebound of the global economy in 2020. Of course, we do not know for sure, but any potential spreading of the virus across the globe – currently the virus has already been reported in 18 countries from Asia to North America – could last until March/April and mark a new downside risk to the global economy in the first half of 2020.
The fact that the World Health Organization has said that the coronavirus comes from the same family of viruses as SARS and MERS have prompted comparisons with the SARS outbreak in 2003. At the time, the news of the SARS outbreak only hit financial headlines in March 2003 and then dominated the headlines for an eight-week period. We can only hope that containment measures prevent an acceleration in the number of cases identified and that the mortality rate does not rise above current reported levels of 4%.
In economic terms, however, the global economy has become more integrated and intertwined since 2003. Global air traffic, for example, is currently more than twice as big as in 2003. Also, contrary to 2003, when Chinese tourism was mainly inbound-oriented, Chinese tourists have become a significant driver of global tourism. Consequently, the speed of the virus spreading could be faster than in 2003, while at the same time the negative impact on global growth could also be higher than in 2003.
Fig. 1 - Coronavirus hits the headlines

What weaker Chinese growth means for trading partners
As Iris Pang notes, the largest impact on Chinese consumption will come through retail sales, travel, tourism and clearly the ability of Chinese residents to return to work. SARS is believed to have knocked 1.0%+ off Chinese GDP back in 2003, but the huge uncertainty around the spread of the coronavirus makes the macro impact very difficult to forecast. A study by Jong-Wha Lee and Warwick J. McKibbin from the Korea University and the Australian National University found that the full impact of SARS on the global economy came close to USD 40 bn in 2003, taking second-round effects between sectors into account.
SARS is believed to have knocked 1.0%+ off Chinese GDP back in 2003, but the huge uncertainty around the spread of the coronavirus makes the macro impact very difficult to forecast
Accurate forecasting of that impact will take time, but clearly slowing Chinese domestic demand will impact the global economy – just as it is trying to recover from the effects of the 2018/19 trade war. Just think of the fact that for some global hotel chains or companies of luxury goods China and Greater Asia accounts already for 10 to 20 percent of their annual sales.
The precise extent to which a weaker Chinese economy impacts its global trading partners will also be uncertain, but a 2016 IMF study may offer some insights here. Even though the study focused on the spill-over effects of China’s maturing economy, one of the simulations included a Chinese cyclical slowdown prompted by financial stress – that stress triggered by ‘a credit event, a re-assessment of growth prospects, or another shock.’
The impact of a 1% cyclical slowdown in China is largely felt in the APAC region where trade linkages are the highest and also in the commodity-producing countries. Notably, the fall-out on the US economy was seen as limited, possibly resurrecting the narrative of wider US-Rest of World growth differentials – a dollar bullish story.
Fig. 2 - Who would suffer the most from a Chinese slowdown

Commodities: China is the kingpin
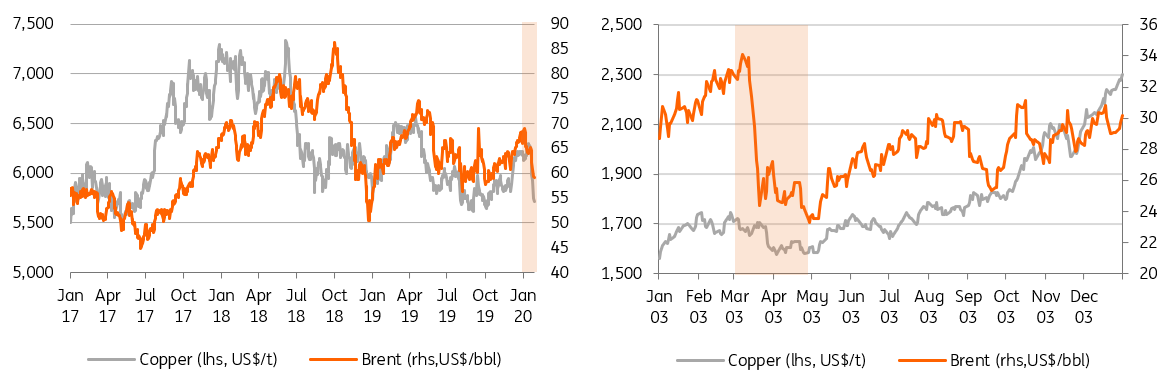
China is the kingpin of the global commodities market. The longer factories remain closed, travel restricted and construction stalled, the larger the ramification for commodities demand. This asset class has seen a massive sell-off since the outbreak of coronavirus in China. At the time of writing, copper prices have fallen by 8.5% from their mid-January peak. Singapore iron ore has collapsed more than 6% and ICE Brent plunged by nearly 10%.
It is very hard to say how quickly this virus will spread but suffice to say we see mounting pressure on commodities. However, the level of damage to their market price will also depend on their exposure to China and their own fundamental story.
Fig. 3 - China’s share in oil and iron ore demand

Copper and iron ore vulnerable, OPEC+ may support crude
Looking first at the metals, the key question is how long will travel restrictions last and when construction and industrial activities resume? A prolonged delay would have an impact on supply chains. This would likely feed through to major sectors where metals demand has significant relevance, including infrastructure, property construction, automotive and other manufacturing industries.
On the oil side, wider travel restrictions are apparently hitting oil demand through jet fuels, gasoil and other middle distillates within China
Copper has relatively healthier fundamentals than the rest as a result of tightened supply in global mine production last year and production growth is expected to be largely muted this year. The market had expected to see demand recover from China in 2020, supporting a constructive fundamental picture. Copper is regarded as the economic barometer, and China accounts for 50% of global copper usage. However, with the absence of China demand short term, downbeat sentiment may be exacerbated since some investors tend to short copper to express bearishness on the global macro view. For iron ore, China accounts for 70% of the global seaborne market. Should the coronavirus prompt a long delay in construction activities, any demand pick-up in iron ore may be postponed.
On the oil side, wider travel restrictions are apparently hitting oil demand through jet fuels, gasoil and other middle distillates within China, along with any spillover across the region. Overall, the global transportation industry accounts for around half of the demand for global crude imports – and has been rising rapidly. Concerns are unsurprisingly reflected in refinery margins, which continue to trade at depressed levels. In fact, the spot gasoil crack in NW Europe is trading under US$10/bbl now - levels last seen in early 2017. The weakness in gasoil cracks has surprised many, given the broadly constructive view held due to IMO 2020 shipping regulations.
However, as oil sink lowers, there is increasing pressure for OPEC+ to extend cuts through until at least mid-year, and that may provide some psychological support. However, the OPEC+ members will be watching developments in Libya closely. Any extended outage there would mean less need to curtail supply amongst the rest of OPEC+.
Fig. 4 - Copper and Brent suffer, as they did during SARS in 2003
FX: Commodity currency rally postponed
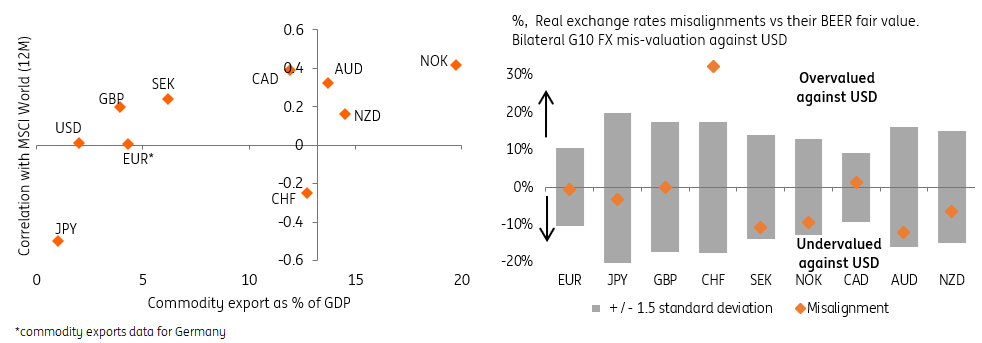
Events in China impact the global currency markets via two channels: (1) the risk channel (as global growth concerns hit equity markets); and (b) the commodity channel (given the importance of China in global commodity demand). In the chart below, we blend the two channels. Unsurprisingly in the G10 space, it is AUD, NZD and NOK (as well as CAD) that stand out given their high beta to risk and the commodity nature of the currencies.
We continue to see AUD, NZD and NOK as the most exposed if market sentiment remains weak. With our commodities team seeing larger downside to metals than oil prices (where OPEC may extend cuts versus a softer floor under metal prices), AUD looks the most vulnerable among these currencies. Supporting this view is also the prospect of RBA easing over the next months (we expect a cut in 1Q) and the ongoing bushfire emergency which may have a sizeable impact on the Australian economy. All this underlines our preference for lower AUD/NZD in the relative value space (where we look for a decline to AUD/NZD 1.02). Among Scandies, this means lower NOK/SEK as SEK exposure to commodity prices is limited.
Unsurprisingly in the G10 space, it is AUD, NZD and NOK (as well as CAD) that stand out given their high beta to risk and the commodity nature of the currencies
Among the majors, JPY and USD should continue their out-performance given their safe-haven characteristics. We look for a lower EUR/USD as the dollar continues to benefit from its safe-haven appeal, while the open eurozone economy is more vulnerable to any impact on the global economy. The story of US exceptionalism (growth outperformance) may return as well.
As long as the situation will be seen as unresolved, the skew to both risk appetite and commodity prices remains on the downside. With G10 commodity currencies largely reversing all their December gains (at the time caused by anticipation of the phase-one deal), this currency segment is now as undervalued as it was prior to the December rally. Still, unless both risk sentiment and commodity prices stabilize, a sustainable rebound is unlikely at this point
As for EM FX, we have observed a similar pattern to G10. Deteriorating risk sentiment is weighing on the generally higher beta EM FX, where the currencies with a commodity exposure are leading the losses (CLP, RUB or ZAR). While Asian FX remains vulnerable due to its direct trade links to China, it is the higher beta, commodity-exposed EM FX leading the losses (partly because the managed decline in CNY is limiting the spillover into regional EM Asia currencies). Should the situation deteriorate, we would expect the same pattern to continue, with commodity EM FX leading the losses. Typically Latam FX and its big metals exposure perform poorly in this environment.
Fig. 5 - Commodity currencies appear the most vulnerable
Rates: Low or lower rates with flatter curves
Market psychology is an important starting point. As we progressed towards the end of 2019 there were numerous good reasons for the 10yr US yield to attempt a break back above 2%. But despite elevated US consumer confidence, tight labour market and an improved trade war narrative that break higher never really materialised. We saw this from the structure of the curve too, as the 5yr remained very rich to 2’s and 10’s, which is a classic sign that a preference was there to test the downside rather than the upside. This is why, backed by weak PMIs, our projections pitched a lower rates bias. Fast forward to January 2020 and it has just taken a flu from China to cause a significant move down to 1.6%.
That is not to underplay the event, as one thing we do know is we are at the beginning of an event that could easily stretch for months. The SARS virus is a go-to template, as there are more similarities than differences and it stretched from November 2002 to June 2003. Remarkably back then the Fed funds rate was very similar to where it is today (1.75%). It had been cut from 6.5% on the dot.com crash, and ultimately got down to 1% after the flu had faded.
First and foremost, rates were already in a stressed mode before the flu virus narrative hit, and the subsequent move has confirmed the path of least resistance – lower rates
It is not easy to break out precise market reactions, but before the flu had receded the 10yr yield had fallen from around 4% down to a little under 3.25%. Part of this was the virus, but a large part was also the other background noise. The curve was already steep (c.200bp), and only steepened further on the final Fed cut to 1%. Away from the virus itself, it is interesting to note the difference in the shape of the 2/10yr curve (200bp) and the level of the 10yr yield back then (4%) compared to now where we have a 20bp & sub-2% combo – a good illustration of the excess of demand oversupply that is driving yields today.
So, there are numerous nuances to consider as we examine the current circumstances. First and foremost, rates were already in a stressed mode before the flu virus narrative hit, and the subsequent move has confirmed the path of least resistance – lower rates. Second, risk assets have been worried about a catalyst that could take back the outsized gains made in 2019, and this virus event is as good a catalyst as any. That vulnerability can become circular and push core rates even lower. However, let’s not get carried away here; it does not mean we need to push our 1.5% target for the 10yr lower though; for that to happen we’d need to see a more definitive turn for the worse.
From a Eurozone perspective, this is the last thing the ECB needs. Europe is already down, with Germany and Italy at the bottom of the spectrum of contemporaneous growth observations, as the ECB practically is out of bullets. The German 10yr yield has shot down to almost -40bp. That said, the Treasury/Bund spread has tightened, which means that the move in US Treasuries has been more significant. There is already a deep negative discount in the price for Eurozone bonds, but with the likely ECB standing pat at -50bp there is a limit to how bad things can get; for that to change, again, we’d need to see a clear turn for the worse on the virus impact.
Bottom line, market rates are likely to remain low; at about current levels or lower in the coming weeks (and likely months). Curves will maintain a flattening bias, as central bank action is unlikely given what we know so far. Reversion to higher rates would need evidence that there has been a positive turn of the tide. In the meantime, an information vacuum perception sustains vulnerability.
Credit: Rollercoaster
European credit spreads widened significantly earlier in the week on the back of the virus news. However, it seems spreads have simmered now. This all comes after we have seen some substantial performance in January, with spreads tightening down to the lower levels seen in 2019. This was in line with our mildly bullish view on credit for 2020, driven by a swing in technicals, lower net supply and of course CSPP. We stand by our long-term call of tighter spreads and flatter curves, but of course, the coronavirus is a potential threat.
As for the underperformance, autos were hit worst, as well as the longer end of the curve, causing some steepening. The Chinese car market, the largest in the world, is very important for European car producers. 2019 had been a dismal year for Chinese car sales and further spreading of the virus could dampen any hope of a recovery this year, pressuring spreads further. In addition, Wuhan accounts for a sizeable portion of Chinese car production.
While the fallout on the economic picture is still unclear, we see a key risk for EM sovereigns with weaker fiscal and external balance sheets as well as those more exposed to a slowdown in China
Energy and some consumer names were also amongst the worst performers on Monday. It is clear that if things are set to get worse it will be these higher beta names that will underperform most significantly. For instance, the consumer sector is looking tighter compared to the industrials, particularly because they have traded very in line in the past. We may see consumers pull back up to this level. We, therefore, stand by our call for being overweight non-cyclical.
Of course, if the news turns more positive, we will likely see Euro spreads return down to the tight spreads we saw last week.
In EM credit space, the fallout has been limited on balance: Credit spreads widened by 17bp (based on Bloomberg Barclays EM USD Aggregate Index) over the last week but this has been matched by a decrease in underlying core rates (with US 10yr Treasuries also rallying 15bp), meaning that all-in yields have little changed on balance. That said, we have seen a spread decompression across the lines of credit quality, with high yield widening by 34bp while investment-grade names remained fairly insulated (+9bp only), implying that there has been a shift into safe havens within the asset class.
Technicals have remained supportive so far with EFPR Global reporting US$8bn of inflows into EM debt in the first three weeks of January, following US$40bn of inflows throughout 2019. Notwithstanding, we expect some softening of technicals and sentiment as the spread of the virus continues. While the fallout on the economic picture is still unclear, we see a key risk for EM sovereigns with weaker fiscal and external balance sheets as well as those more exposed to a slowdown in China. Aside from trade and investment channels (with EM Asia, Sub-Saharan Africa and commodity producers most affected), we would be concerned on a reversal in the strong investor sentiment in EM credit.
Fig. 6 - European Investment Grade spread developments, by sector

This publication has been prepared by ING solely for information purposes irrespective of a particular user's means, financial situation or investment objectives. The information does not constitute investment recommendation, and nor is it investment, legal or tax advice or an offer or solicitation to purchase or sell any financial instrument. Read more
Download
Download article
29 January 2020
Gauging the cost of the coronavirus This bundle contains 7 Articles