Copper: What’s it going to take to flip the curve?
The street has turned increasingly bullish on copper for 2018. We see the rationale but need to yet be convinced that refined rather than concentrate markets will tighten significantly this year. Copper's wide contango sits oddly amongst the base metals, discouraging longs. If it flips, the upside could be huge but when is the question
Copper's contango conundrum
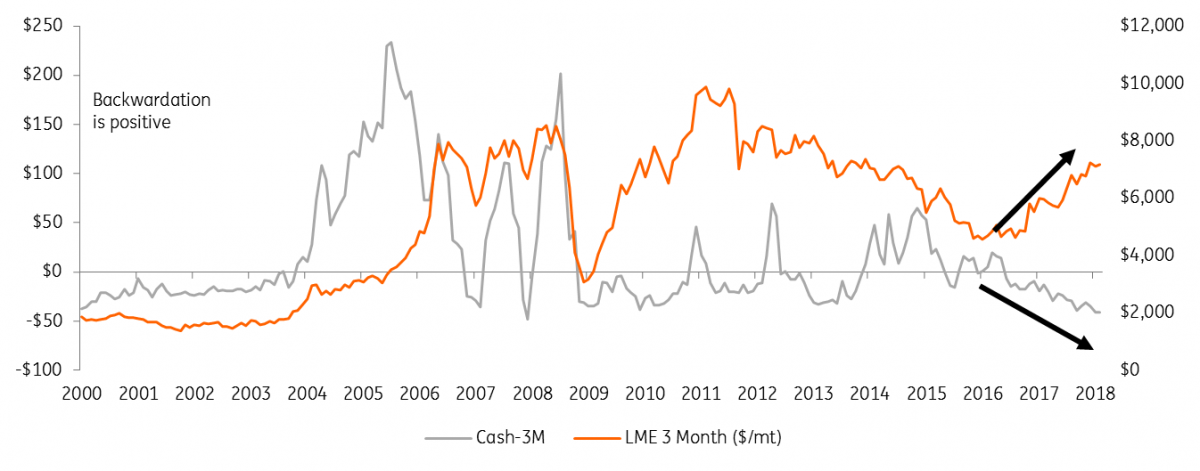
The Copper Cash-3M spread on the LME has year-to-date averaged a huge $40 contango. It widened progressively through 2017, even as prices rallied 31%. These are levels rarely seen through the last 20+ years and would traditionally demonstrate ample supply which should be a negative for markets. Such a contango makes it costly for longs to roll positions, profitable for shorts, and encourages producers to sell forward. Whilst prices can and do rally without backwardations forming, it is harder to see funds sticking with the bullish copper narrative if come Q4, markets are yet to show tightness and keeping a long position remains a costly business.
Copper rally is yet to see any support from the curve ($/mt)
Some stock is more available than others
The size of the contango clearly needs an explanation beyond just the lack of a tight refined market. If spreads reflect the availability of metal, then the current situation reflects that some copper stocks are more available then others.
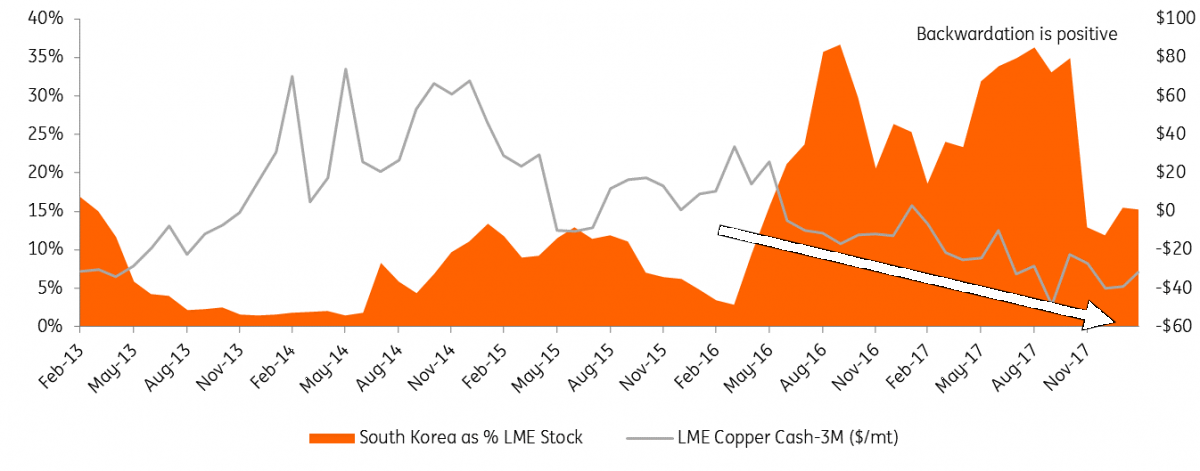
North Korean tensions intensified through 2016-17 and at the same time, South Korea increased its share of LME stockpiles to highs of 35%. The higher cost of financing/insurance made South Korea the biased region for LME shorts to deliver warrants on to clearing, these are then transferred to any of the outstanding longs. As revolving stockholders hastily offloaded South Korean stock by selling nearby LME positions this, in turn, perpetuated the copper contango. The unloved stockpile has since reduced to 15% of LME inventory since South Korean-China cathode imports were up 30% in H2 2017 and the region was left out from the latest batch of big copper deliveries.
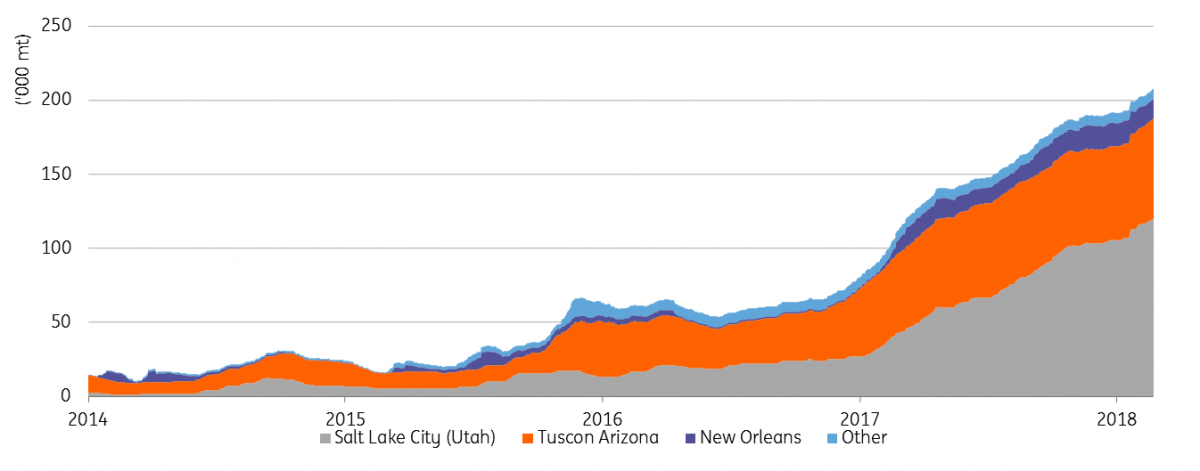
As the South Korean stockpile normalises, a new beast rises in the States. Comex copper stocks, led by Utah, have swelled 160% since the start of 2017, to 230kt which dwarfs the 33kt in LME American sheds. The trade originally started against a risk of US trade duties. The customs cleared status of Comex sheds saw the CME-LME arbitrage widen so traders shifted stock to exploit the gap. The flows were surely boosted by incentives, low Asian premiums, and expectations of US shortages. Now given a surge in domestic freight costs, that stock is appearing isolated from consumers so the willingness to deliver on to clearing sees comex spreads widen even more than the LME.
Should these stockpiles indeed remain ‘’more available”, shifting the curve will undoubtedly require more extreme tightness in physical markets then our base case for this year's supply-demand balance allows.
Curve widened as stock accumulates in South Korea
Surging Comex stock isolated by freight
Upstream vs downstream
All current signs of tightness in copper markets sit solely in raw materials. Bulls point to the treatment and refining charges which have fallen 23% since October and are even below the lows last year when Escondida and Grasberg suffered outages. We do believe the concentrate markets suffered a 150kt shortage last year and stocks will see another drawdown by the end of this year, but we also suspect these aggressively low charges are running ahead of any current tightness. Well-publicised labour negotiations play on sentiment whilst growing smelter capacity adds to competition. Over 1Mt of Chinese smelting capacity might come online this year contributing to a more than 5% increase in global capacity, but this will actually far surpass actual demand for cathodes, which will grow closer to 2%.
Refined markets do not share the same tightness as concentrates, evident in both the loose curve and low physical premiums. Whilst premiums don’t tend to rally until into Q2, SMM’s assessment of the Yangshan premium, is only mildly up on this time last year which is disappointing considering the wide contango for financing and the rally in LME prices.
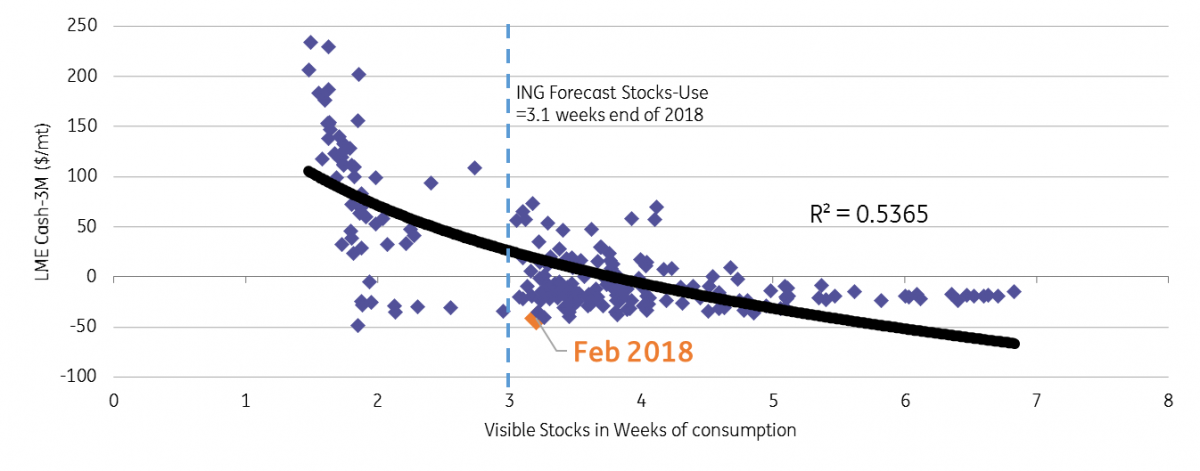
The mild premium environment supports our analysis that the refined copper market was essentially balanced last year, GFMS even reckons a slight surplus. We forecast this year is set for an uninspiring 2018 deficit below 50kt. Visible stocks will therefore remain at 3.1 weeks and well in the range of loose spreads. Only a shift below the three-week mark seems able to definitively secure a tighter spread environment. The incremental demand and another flat balance renders this possible by 2019, which is why we are then forecasting prices to go higher, but such a move in 2018 requires an aggressive cut to supply expectations. This could be possible via higher disruptions (strikes) or Chinese scrap restrictions. Both do surely present upside potential that could significantly change the curve and price outlook, but as we argued in our 2018 outlook, bulls might be too quick to price these in.
Copper stocks (in weeks) vs Cash-3M ($/mt)
Bulls pricing mine strikes too soon
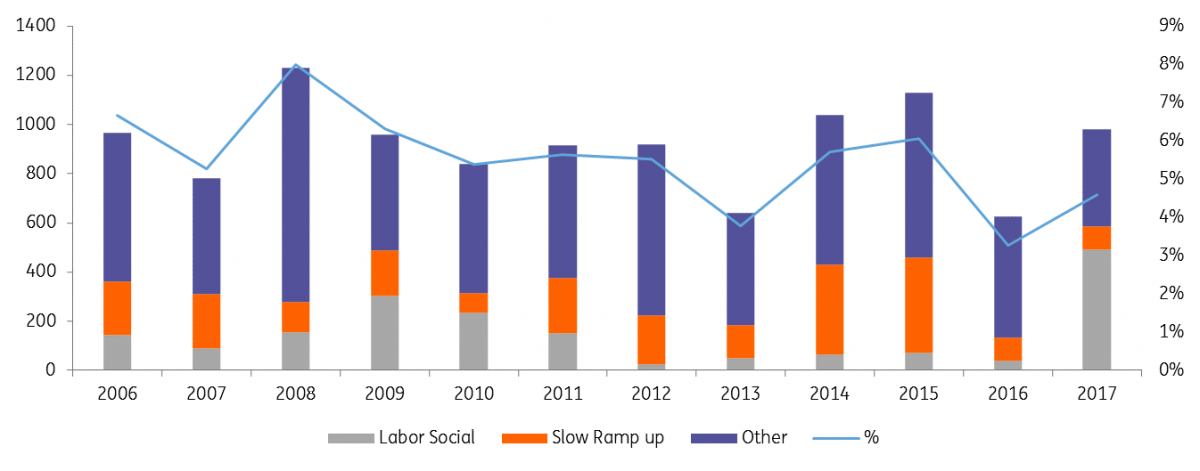
Given the high amount of labour contracts up for renewal at mines this year, more bullish commentators have taken to already assuming above-normal disruption losses for the year. We think this sets room for disappointment. The historical average is around 5% and an incremental 1% bull case costs almost 200kt of concentrates. This would majorly draw down stocks and hit smelter output. On such a scenario we estimate refined stocks drop to 2.8 weeks, backwardations form and prices easily surpass $7,500/mt. The upside potential is there but this is the lower probability outcome.
We stick to the historically tested 5% disruption and would point out that even with last year's lengthy disruptions at Escondida and Grasberg, last year’s rate came in below 5% (Teck estimates 4.6%). We have highlighted that strike losses depend on length not number, many issues get resolved without a production loss. The Escondida stand-off lasted 44 days last year, a modern record, and whilst Escondida negotiations remain the big swing for the year, we question the appetite for either worker or miner to withstand such another long strike. Most negotiations are up for renewal in H2 for which we have already seen early resolutions for Centinela, Andina and talks proceeding at Los Pelambres. As more positive news flow emerges, absent of refined tightness, prices will struggle to rally higher.
The 6% bull scenario, whilst inflating the strike factor also forgets that most disruption is actually technical and often relating to new ramp ups. Absent major greenfield projects, last year's disruption was below 5% even with very high strike loss. This year also most new supply will be recoveries from Escondida/Grasberg, high grading (eg. Anglo) and brownfield (Katanga/Toquepala). Less greenfield could give more room for strikes to be absorbed within a typical allowance.
Copper mine disruptions below 5% last year, with less slow ramp ups
This publication has been prepared by ING solely for information purposes irrespective of a particular user's means, financial situation or investment objectives. The information does not constitute investment recommendation, and nor is it investment, legal or tax advice or an offer or solicitation to purchase or sell any financial instrument. Read more
Download
Download article