Canada’s yield curve: Should we be worrying?
Canada’s 10-2 year treasury yield spread has being flattening since the beginning of 2017. But now below 0.2% and a central bank still in hiking mode, an inversion doesn’t seem too far of a stretch – an indicator that is thought an accountable signalling mechanism for recessions. So, should we be worrying?
Canada’s economy is transitioning from the upward end of its economic cycle and is expected to undergo a mild slowdown; average growth forecasts for 2019 and 2020 are 2.1% and 2%, respectively, both down from the 2.5% we see in 2018. And the yield curve seems to be telling a similar story.
| 2.1%, 2% |
Average growth forecasts for 2019 and 2020, respectively |
The yield curve's predictive power has had a decent track record
The Canadian 10-2 year treasury yield spread has being flattening since the start of 2017, narrowing now to sub 0.2%; this is similar to pre-financial crisis levels in 2007. An inverted yield curve (when short-term rates rise above long-term rates) is often used as a tool to signal recessions, and it’s had a pretty good track record. An inversion of the US 10-2 year treasury yield spread has preceded the past nine recessions going back to the 1960s (see here).
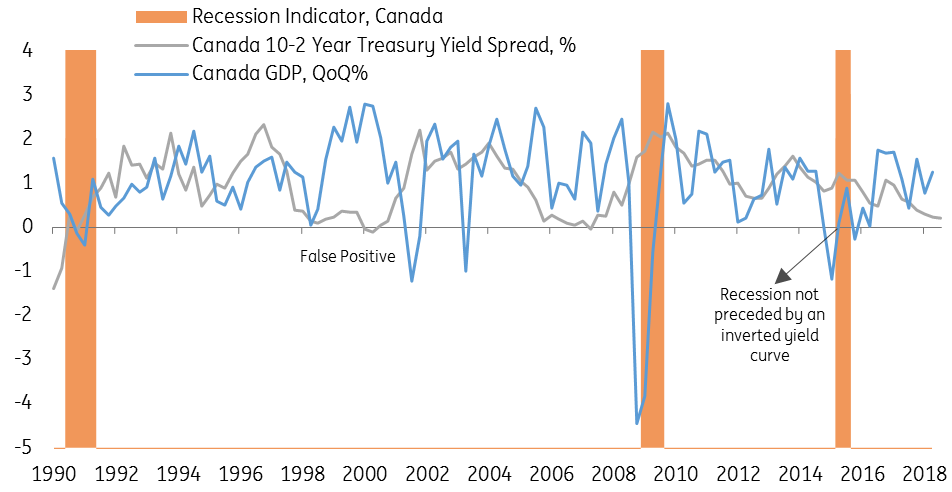
Canada 10-2 year treasury yield spread versus GDP

But there are exceptions...
We have an anomaly in Canada’s case above; there was no yield curve inversion ahead of the 2015 recession, though this can be explained. Canada’s economy is heavily dependent on the oil industry, and plummeting oil prices in 2014 helped tip the economy into recession. Collapsing oil prices are an exogenous risk and, in turn, aren’t equated for in the yield curve. Along with this, the Bank of Canada’s (BoC) pre-emptive action, ie, providing two rate cuts, decreased the chance of inversion; this will have lowered the short-end of the curve.
So given we are on the cusp of inversion, how worried should we be?
Central bank activity is disfiguring yield curve flatness
The BoC’s governor Stephen Poloz argues this mechanism is distorted, previously stating there’s an overwhelming demand for long-dated bonds that is pushing yields lower than they should be. Since the 2007 financial crisis, the Fed and other central banks in major economies have participated in buying government bonds in an attempt to support economic recovery.
The overwhelming demand for long-dated bonds is pushing yields lower than they should be
The BoC didn’t jump on board, but the sheer scale of the bond buying programme affected financial markets not just on a domestic level – but globally. This, coupled with the BoC pushing policy rates higher, leads to a yield curve flatter than it would otherwise be.
False positives: Do they come out of the blue?
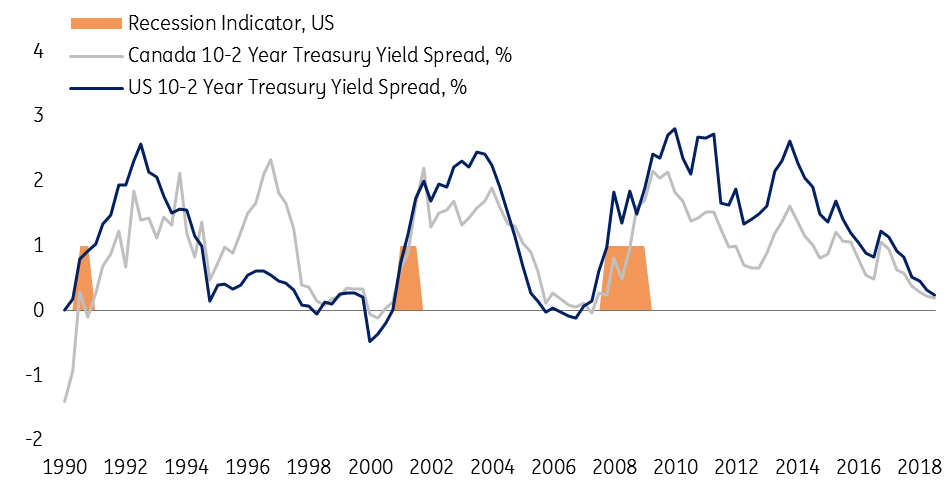
And then there are the false positives; where the yield curve inverts but isn’t followed by a recession.
In the year 2000, both the US and Canadian yield curves inverted. And given Canada tends to closely track the US economic cycle, this isn’t a surprise. But the economies structural differences can be seen; the inversions preceded a US recession, but Canada, though it underwent a slowdown, didn’t enter a recession. This is a false positive result.
In this case, the false positive has an answer. Oil prices held up relatively well during the US downturn. So again, Canada’s reliance on natural resources (more so than the US) seems to be a plausible reason for anomalous results – those implying an inverted yield curve as a recession-signalling mechanism has its flaws.
Canada versus US 10-2 year treasury yield spread

Take the yield curve with a pinch of salt
How big the pinch of salt is will affect the BoC’s policy decisions. There are two possible outcomes.
If policymakers aren’t too worried about the yield curve flattening and possible inversion, then they’re likely to continue pushing rates higher as expected.
If policymakers see the yield curve as a reliable predictor of reduced future growth, then they may consider slowing the pace of tightening or even pausing - particularly if the curve became inverted.
The first outcome of the two we see most plausible. Poloz has already made comments that the mechanism as distorted and, in its most recent October monetary policy report, the BoC made no indication that it was going to be holding back; there was clear intention to push the policy rate into the BoC’s estimate of the nominal neutral rate (2.5-3.5% based on at-target inflation).
Does this mean the bank is okay with the prospect of inversion?
Well, according to our forecast, yes. Canadian 10yr treasury yields should sit around 3% in both 2019 and 2020. So if the bank was to push policy rates well into the neutral range, then the yield curve would inevitably invert.
Canadian banks are likely to face a tough time in an environment of an inverted yield curve (paying short term interest, but receiving interest on longer term loans and mortgages). This is a risk that would likely impede profitability.
The BoC should continue to hike
Solid economic growth, near four-decade low unemployment levels and both core and headline inflation measures on (or above) the bank's 2% target should keep the BoC tightening. We predict two further hikes next year, in 1Q19 and 3Q19, and aren’t ruling out a third, albeit subject to downside risks (such as weak wage growth) fading.
Our policy rate forecast slightly subdues the risk of inversion. Even if we price in a third hike next year, this would take the policy rate to 2.5%. And if our forecast for 10yr treasury yields are correct, then any inversion would be hinged upon expectations for the coming years, ie, what will happen to 2yr treasury yields?
Inversion or not, some kind of slowdown is on the horizon, but it’s difficult to see what might push Canada into a recession. We possibly could be set for another false positive.
This publication has been prepared by ING solely for information purposes irrespective of a particular user's means, financial situation or investment objectives. The information does not constitute investment recommendation, and nor is it investment, legal or tax advice or an offer or solicitation to purchase or sell any financial instrument. Read more
Download
Download article