USD rates: Get ready for big falls in rates
- 10 November 2022
- Rates
The year ahead will mostly feature falling market rates, as the Fed peaks out and the market anticipates future rate cuts. The curve should dis-invert through the year, and ultimately will steepen out from the front end. The fall in rates will come from the back end first, but should later be dominated by falls in front-end rates in the second half


The first quarter will be about identifying peak levels for rates
The first quarter of 2023 should be quite different to the following three quarters. As we start the new year, the Federal Reserve will still be in hiking mode. The pace of hikes will have slowed and the peak for the funds rate will be edging closer. But that peak will not be in place at least until we get through the 1 February Federal Open Market Committee (FOMC) meeting. After that meeting, the funds rate ceiling should be at 5%, and that should be it for the hikes.
Market psychology will rapidly morph towards anticipating future easing moves.
However, we won’t know for sure until we get through the 22 March FOMC meeting. A pass here would officially bring the rate-hiking process to an end, and typically once the market senses that the Fed is done, the next job is to start to discount the elevated probability for the next Fed move to be a rate cut. As we progress through the first quarter, the market psychology will rapidly morph towards anticipating future easing moves.
Even if the Fed says with a straight face that interest rate cuts are not being contemplated, history shows that as soon as the Fed hits a peak we’re usually less than a half year away from interest rate cuts. The dot com bust provides an example of how market rates can shoot below the funds rate once the peak is in, and for that to be followed by Fed fund rate cuts.
Market rates swiftly move lower once the Fed funds rate has actually peaked (dot com bust example)
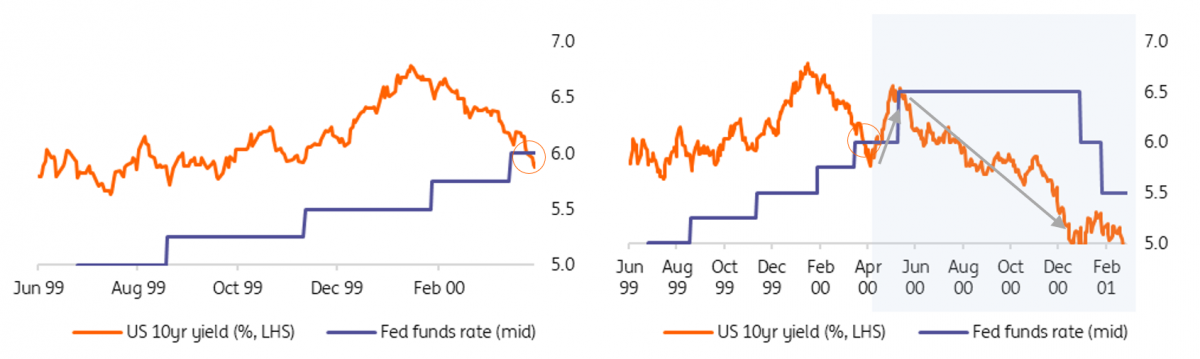
When the funds rate peaks, the 10yr pre-peaks at 25-50bp below it
History shows that the 10yr yield typically trades some 50-75bp below the funds rate before the Fed reacts and begins to cut rates. The most extreme version of that was during the dot com bust when the 10yr traded some 150bp below the funds rate on the eve of the first cut, and was 100bp below the funds rate a full month before the Fed actually delivered a (50bp) cut, as shown in the chart above.
Moreover, this is starting from a place where the 10yr tends to peak at the same level as the funds rate, with the 10yr typically getting there first (and the 2yr before that). The only material exception to this was during the tightening cycles of the 1970s and early 1980s when the funds rate was pushed to levels considerably above the 10yr yield.
On the downside, the funds rate tends to hit a bottom that is far lower than where the 10yr yield gets to, steepening the curve in the process. That deviation has been in the region of 3-4% during the last few rate-cutting cycles. For example, after the great financial crisis, the Fed got down to 12.5bp with the 10yr Treasury yield at 4%. And in 2004, when the Fed bottomed at 1.25% the 10yr yield was in the region of 4.5%.
The second quarter leaves a vacuum for market rates to collapse into
So, what about the cycle ahead of us? We see the effective funds rate peaking at 4.83% (within the 4.75-5% range). Given the ongoing shortage of collateral versus liquidity (reflecting past Fed bond buying), the US 10yr Treasury yield could undershoot that peak, we think by some 25bp to 50bp. That suggests a peak in the 4.25-4.5% area (rounded). This may well remain a talking point right up to the early part of 1Q 2023.
The Fed then holds at the peak for a few months (three to six perhaps) and then starts to cut by mid-year 2023, to help cushion recessionary forces. We see the Fed getting to a 4% funds rate by the end of 2023, a cumulative 100bp in cuts. And we think they ultimately get down to 2.5% in 2024, giving us an implied effective funds target terminal rate of 2.33%. This is important for mapping out the 10yr yield, where we look at history, and add some modern caveats.
First, we are suggesting that when the Fed peaks, the 10yr yield will be 25-50bp below that peak, reflecting a Fed balance sheet still bloated with bonds. Second, once the Fed does peak, the 10yr should shoot lower, and we are anticipating an initial target of 3.5%, which would be 150bp below the funds rate ceiling. That would happen quite quickly, so much so that we could be there by the second quarter.
Beyond that, trading between 3-3.5% with a downside bias would be the call for the second half of 2023. Essentially, we’re talking about a structural break back below 4% as being a theme for 2023; and concluding the year much closer to 3%.
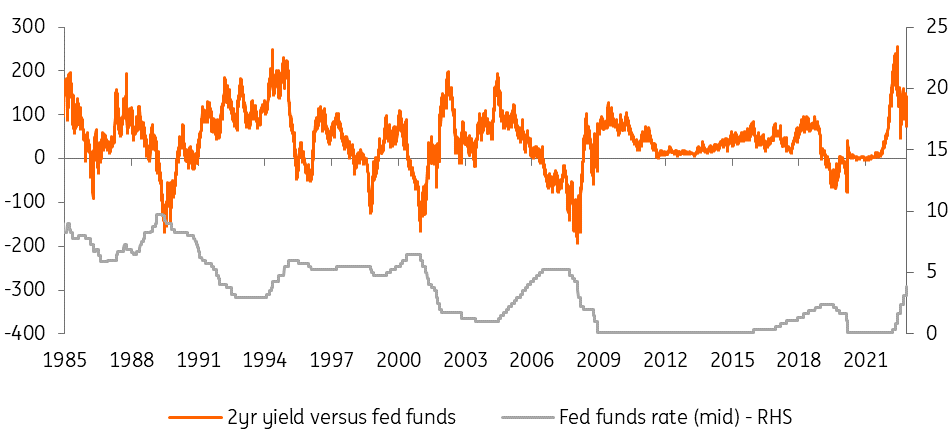
The 2yr tends to trade 150bp through the funds rate as the cutting cycle begins
Dis-inversion and curve steepening on the 2/10yr segment ahead
And what about the curve? The dominant theme is dis-inversion, and ultimately curve steepening. The 50bp inversion currently being seen should initially be unwound from the front end. The 2yr yield should move from the 4.5% area when the Fed peaks at 5%, to quickly discount a lower fed funds rate in the coming couple of years.
The 2yr is likely to target an end game in the 2.5-3% area, but the dynamics about getting there will be different compared with the 10yr. The initial move lower in rates will come from the 10yr, as the 2yr is more closely tied to the contemporaneous funds rate. So, when the 10yr potentially trends towards 3.5% in the second quarter, the 2yr is likely to be closer to 4%, or just below. So, the 50bp inversion persists longer than many might expect.
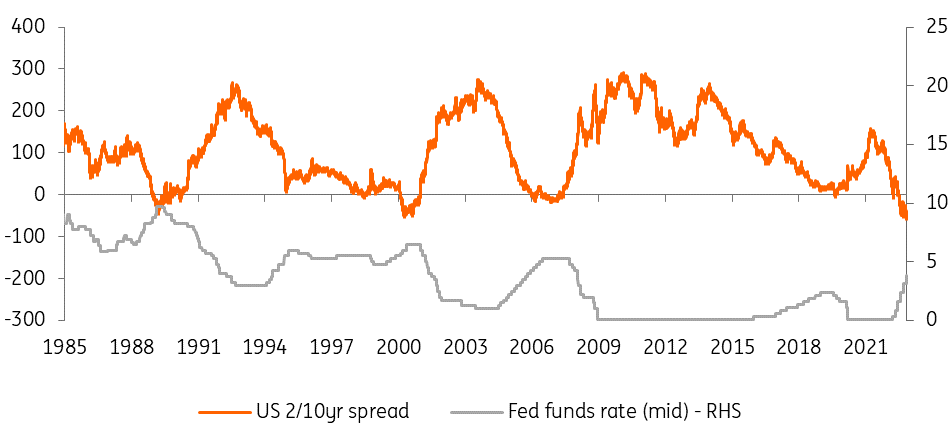
But the second quarter into the third quarter is when the curve really dis-inverts and ultimately steepens out, and by the third quarter, the 2yr is heading down to sub 3% while the 10yr remains above 3%. The end game sees the 2yr down at 2.5% while the 10yr settles closer to 3%, marking a 50bp positive difference between the 2yr and the 10yr. This marks a cumulative 100bp swing overall on the 2/10yr segment, from a 50bp inversion to a 50bp positive curve.
The 2/10yr curve typically stretches to over 100bp when the Fed is cutting
Watch for a steeper 10/30yr spread, and a richer 5yr to the curve
On the 10/30yr segment, the outcome is more straightforward – we expect to see a gradual one-way re-steepening process. As the 10yr falls to 3.5%, the 30yr should fall by less, settling in the 3.75% area. And should the 10yr head to 3%, the 30yr should not get much below 3.5%. That marks a 100bp curve between the 2yr and the 30yr by 2024, compared with a 40bp inversion currently.
The other big move in the curve will be in its structure. Currently, the 5yr is trading cheap to the curve. Over the course of the first quarter of 2023, the 5yr should richen, targeting a position where it is traded below the interpolated line between the 2yr and the 10yr yield (to trade rich to the curve).
In absolute terms, the 5yr can trade 15bp rich (or 30bp in gross terms) or even deeper versus the 2yr and 10yr interpolation. It should remain there then until the Fed starts to cut, and for most of the rest of 2023 in fact, as the market remains bullish for bonds, and the Fed remains in rate-cutting mode as we slip into 2024.
Content Disclaimer
This publication has been prepared by ING solely for information purposes irrespective of a particular user's means, financial situation or investment objectives. The information does not constitute investment recommendation, and nor is it investment, legal or tax advice or an offer or solicitation to purchase or sell any financial instrument.Read more

Included in the following bundle

Rates Outlook 2023: Belt up, we’re going down
- This bundle contains 9 Articles