Trade in 2018: Nowhere close to its heyday
Trade in 2018 will pick up speed but rebalancing of the Chinese economy and global value chain trends mean we won’t see world trade growth doubling GDP growth, as it did before the crisis
With fourth-quarter trade data still to come, we expect 2017 to be the strongest year for world trade since 2011. With an annual growth of roughly 4.5%, world trade will outpace world GDP growth for the first time in six years.
World trade exceeds world GDP growth in 2018 and 2019

However, the high growth rate this year is largely the consequence of a favourable carryover effect from last year. Trade dipped in 1H16, but it recovered strongly towards the end of the year. Simply hanging on to the trade level of December 2016 – with no growth whatsoever in 2017 – would already have been enough to deliver a 3% annual trade growth in 2017. So 2017, has done a little better than this, but not much.
Don't let the data fool you
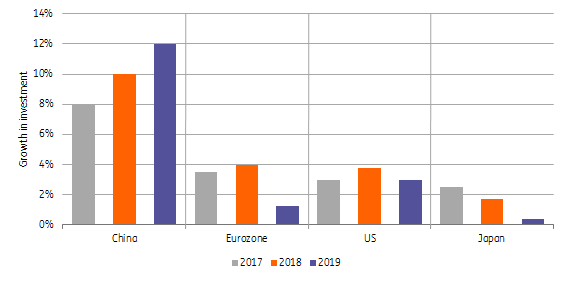
In 2018, trade growth will pick up some speed thanks to increases in GDP and investment growth in the largest trading nations. Japanese growth will come down, but US growth will pick up. Russia and Brazil will continue recovering from their recessions in recent years. Economic growth in the Eurozone will cool off a bit, but investment growth will increase.
We're not expecting a surge in trade growth in 4Q17 like 4Q16, so the carryover effect should be smaller in 2018.
These developments should deliver higher monthly trade growth, but annual growth in world trade for 2018 as a whole is expected to be lower than 2017, at 3.7%. This is because the base for comparison is less favourable. We're not expecting a surge in trade growth in 4Q17 like 4Q16, so the carryover effect should be smaller in 2018. In 2019, we expect investment growth in the major trading countries to slow somewhat and, hence, trade growth to fall back to 3.25%.
Higher investment growth in 2018, but lower in 2019

Although world trade growth is set to outpace the growth of world GDP in both 2018 and 2019, this will only be by a small margin, and nowhere close to the decade before the financial crisis when world trade grew twice as much as world GDP. This was, among other things, the result of the fast spread of global value chains, boosting business in intermediates.
Offshoring has lost its appeal
The latest data on global value chains indicate offshoring has slowed. The data shows production chains are contracting, which is reflected in less cross-border trade in intermediates, which are no longer rising as a share of global trade.
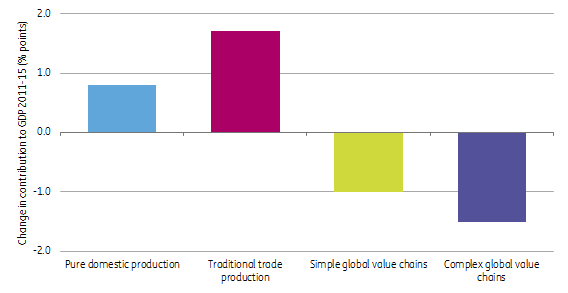
The contribution to world GDP from products made within a global value chain has declined since 2011.
Global value chains are adding less to GDP

One of the reasons for the lower trade in intermediates is China increasingly using domestically produced intermediate goods in place of imports, which is reflected in its declining import ratio.
The Chinese economy is less import intensive

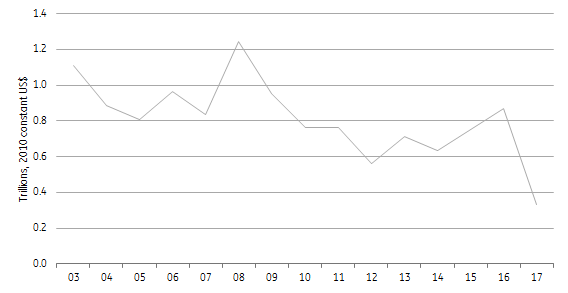
Greenfield foreign direct investment flows have - with the exception of 2016 - have remained weak in recent years compared to the period before the crisis and taken a nosedive in 2017. As with the stagnating growth in the share of intermediate goods in total trade, this suggests that offshoring is not about to generate another acceleration in world trade growth.
Nosedive for Greenfield FDI flows in 2017

China’s broader rebalancing strategy towards consumption and away from exports also limits the potential for trade growth, because the import intensity of consumption is lower than that of investment and exports.
Protectionism: the dog is barking but will it bite?
Protectionism in the Trump era is the barking dog that hasn’t really bitten in 2017. World Trade Organisation (WTO) figures published in November show that G20 countries introduced an average of three trade restrictive measures per month in the past six months, the lowest rate in the post-crisis period.
Fewer restrictive measures in the Trump era

Trade facilitating measures, in the meantime, continued to be introduced at a rate similar to previous years. These measures are not limited to national or bilateral agreements, but also include important international agreements that will stimulate international trade in the coming years. This includes ratification of the 2013 Bali Agreement to lower custom barriers, the extension of the free trade agreement for IT products (ITA) and the decision of TPP countries to go ahead with liberalising trade without the US. It all shows that free trade is far from over.
Nevertheless, the downside risks from protectionist policies remain. We have not heard the final word on NAFTA re-negotiations yet, and the situation certainly looks dangerous. Were NAFTA to fail, it would be a severe blow. The same risks are involved in the prospective EU and the UK trade agreement, where the best outcome can only be neutral for world trade, but risks are firmly on the downside.
Download
Download article3 January 2018
ING’s outlook for 2018 This bundle contains {bundle_entries}{/bundle_entries} articles"THINK Outside" is a collection of specially commissioned content from third-party sources, such as economic think-tanks and academic institutions, that ING deems reliable and from non-research departments within ING. ING Bank N.V. ("ING") uses these sources to expand the range of opinions you can find on the THINK website. Some of these sources are not the property of or managed by ING, and therefore ING cannot always guarantee the correctness, completeness, actuality and quality of such sources, nor the availability at any given time of the data and information provided, and ING cannot accept any liability in this respect, insofar as this is permissible pursuant to the applicable laws and regulations.
This publication does not necessarily reflect the ING house view. This publication has been prepared solely for information purposes without regard to any particular user's investment objectives, financial situation, or means. The information in the publication is not an investment recommendation and it is not investment, legal or tax advice or an offer or solicitation to purchase or sell any financial instrument. Reasonable care has been taken to ensure that this publication is not untrue or misleading when published, but ING does not represent that it is accurate or complete. ING does not accept any liability for any direct, indirect or consequential loss arising from any use of this publication. Unless otherwise stated, any views, forecasts, or estimates are solely those of the author(s), as of the date of the publication and are subject to change without notice.
The distribution of this publication may be restricted by law or regulation in different jurisdictions and persons into whose possession this publication comes should inform themselves about, and observe, such restrictions.
Copyright and database rights protection exists in this report and it may not be reproduced, distributed or published by any person for any purpose without the prior express consent of ING. All rights are reserved.
ING Bank N.V. is authorised by the Dutch Central Bank and supervised by the European Central Bank (ECB), the Dutch Central Bank (DNB) and the Dutch Authority for the Financial Markets (AFM). ING Bank N.V. is incorporated in the Netherlands (Trade Register no. 33031431 Amsterdam).
