Industrial Metals: Don’t fight the flows
Flows, rather than fundamentals have directed metal markets this year. The complex is benefiting from a weaker USD and a broader commodities allocation on reflationary themes. Sure enough, last Friday's dollar rebound shook some investor rationale.
But prices are high, and the two largest metals, copper and aluminium are down year-to-date as December inflows slowly unwind. The smaller metals are up with support from the visible falling stocks.
Aluminium: The semi's balancing act
LME Aluminium continues to hold above $2,200 with support from tighter LME spreads that must compete with rising premiums for ingot deliveries. Shanghai prices meanwhile are down 15% from the September peak. A wide export arb could pressure LME in the coming months, but given an ex-China deficit, we think the longer-term question is the extent these two price regional prices can diverge.
China vs ex-China
We expect ex-China smelting supply to increase by around 1 MT next year led by India, and assuming several restarts in the US. Still, we expect this will fall short of ex-China demand by around 1.5MT leaving a surplus China and depressed local prices to play the balancing act through semi’s exports.
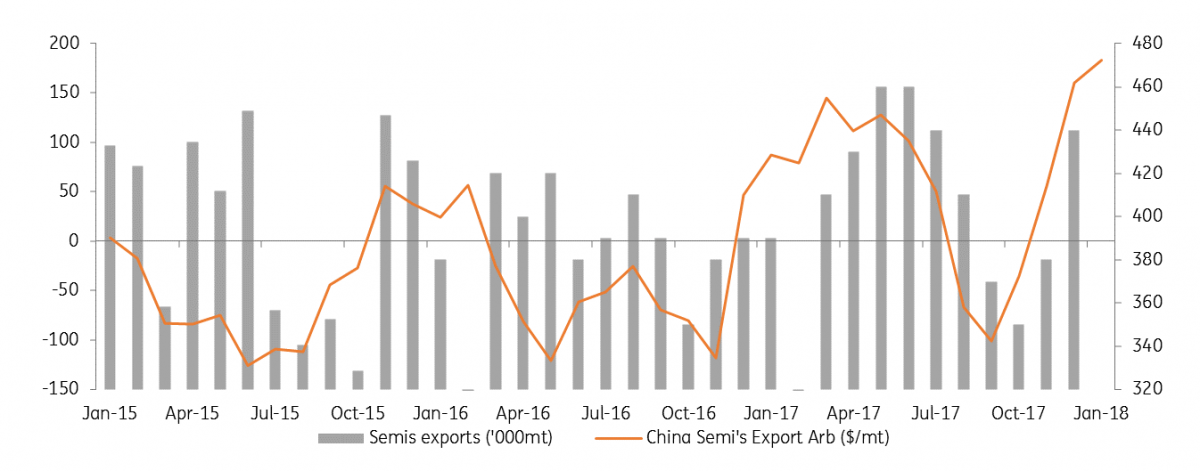
The export arbitrage for semi’s is currently the most supportive since 2011 on just the spread between exchange prices, while high US premiums boost profits further for those rushing to export to ahead duties. We expect the January export number (on Thursday) will be bearishly high and poses near-term downside risks for LME prices should be dollar support tail off. Further out, however, we are bullish. Increased trade protectionism could curb exports and leave the Chinese surplus increasingly isolated. The LME’s tightness also reflects a thirst for primary ingot in a tight ex-china market with the power to squeeze out shorts.
Arbitrage to drive higher semi's exports

Premiums and backwardations face off
US Midwest aluminium premium is now trading at 12c/lb according to Platt’s with the CME curve pricing 13.75c/lb by July. Traders cite rising freight costs as new rules around electronic logs curb already tight trucking capacity. Truckstop data shows Midwest rates are up 30% YoY but have now slid for four straight weeks from $3/mile to $2.7/mile. By rights, this should have seen a 1c/lb easing of the premium, but further upward momentum has followed from the Alcoa ABI smelter lockout and fears surrounding 232 imposed trade duties.
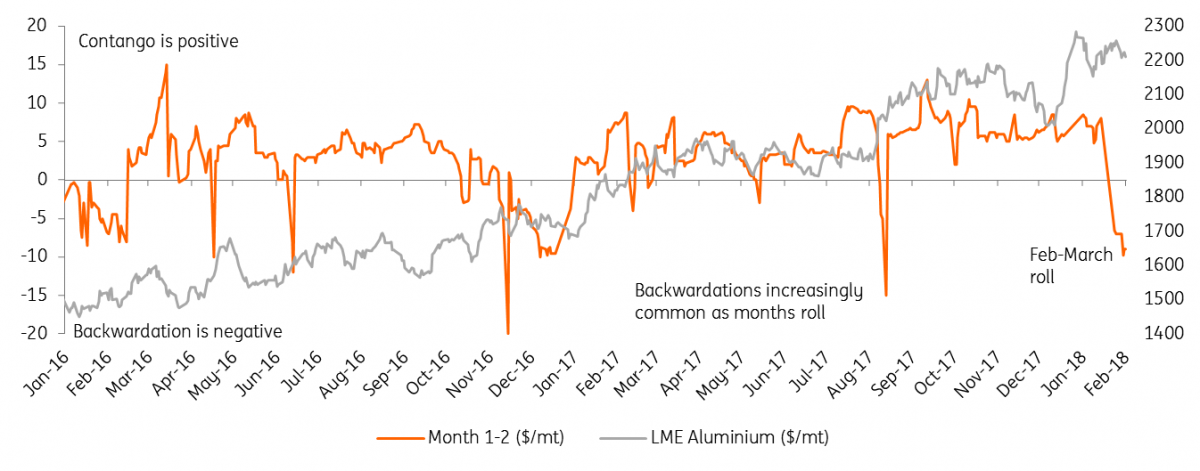
The LME warehouse network meanwhile is thirsty for primary metal. Live stocks at 844kt might be only 5-10% of total inventory. A resulting imbalance between lending-to-borrowing is increasingly seen when the big off-warrant hedges roll and create deep pockets of backwardation. The Cash-3 is now at $0.2b, and the Feb-March roll has hit $8.75b which will need to steepen still if it is to attract deliveries versus higher premiums. We see the LME tightness as a major reason for Aluminium’s recovery since 2015 and the potential for more relative strength on LME compared to Shanghai.
Sharp monthly LME backwardations increasingly common

Zinc: A sprint to the finish
LME Zinc reached fresh decade highs of $3,557/mt last week as a deeper backwardation’s squeezed out the shorts but flat premiums and Chinese inventory suggest the market is not as tight as LME stocks suggest. Zinc fundamentals should begin to ease this year but a last surge higher will depend on the availability of stocks and the resilience of the backwardation.
Feeling the squeeze
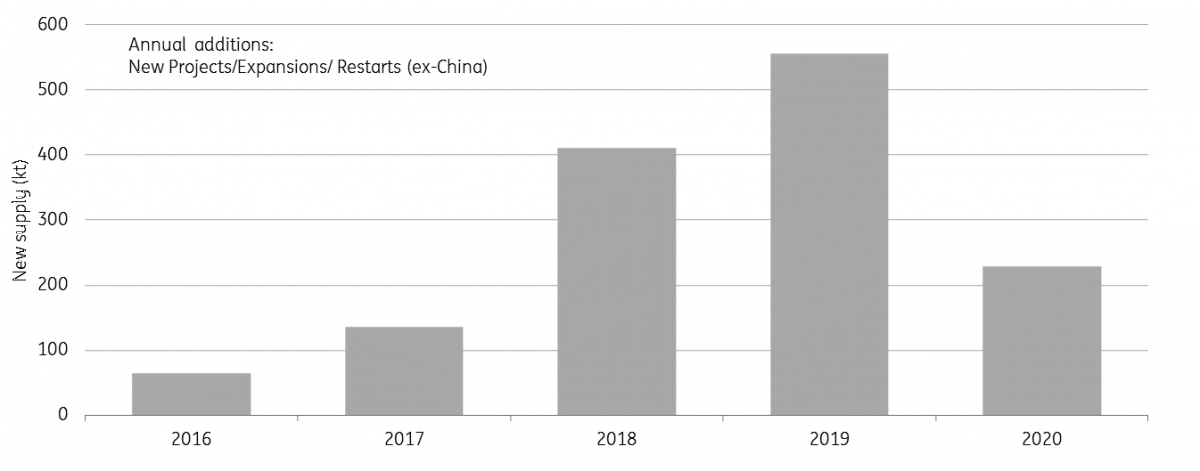
The fundamental story that drives the zinc rally is nearing its final chapter. A returning pipeline of new projects and re-starts will itself add 410kt in2018 and 600kt in 2019 (ex-china). As higher prices incentivize high grading at existing projects (Penasquito, Antamina) and Chinese supply grows this will be closer to 1Mt. Spot TC’s have slid to $18/t (down $7 since December) reflecting the current concentrate tightness, but miners and smelters are wide apart ahead of annual benchmarks. On the one hand, markets are set to loosen in H2, but smelters are resisting more wide differentials to spot, esp. in H1.
If we learnt one lesson from Zinc in 14/15, it is the lag that can occur between tightness in raw materials and the refined markets. Refined will stay tight this year. (ILZSG forecasts -223kt) but it will be up to the market to decide if it prices basis the upstream or downstream trends.
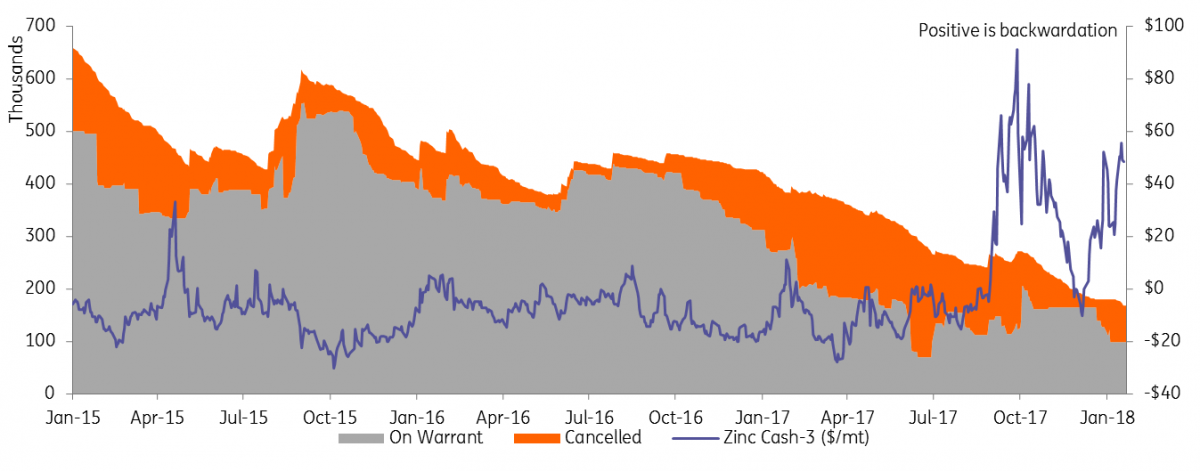
LME Zinc in deep backwardation as stocks drawn down

On the LME the refined looks tight. LME Zinc cancellations are up 54kt which drove the Cash-3 to backwardations as high as $55.5b. A resulting 13% drop in the squeezed producer/merchant shorts in mid-Jan drove first prices above $3,400 on Jan 15.
While we fundamentally see prices nearing their peak, a short-term rally to higher levels will depend on the power of the backwardation and the endurance of those holding stocks off-warrant. Much stock has been drawn down; some sent to China as evidenced by a 15-fold increase of Spanish slabs imports in 2017. Other New Orleans stock has been used to supply locally (offsetting Valleyfield strikes) and the continued availability of such material will be crucial through the deficits. We recommend watching premiums in Europe/US in addition to China for clues of real metal availability. Premiums in the west have been fairly flat all through 17, and Chinese premia is now down 28% since August suggesting markets are not as tight as the LME stocks and spreads suggest. Chinese stocks are looser with SMM reporting total social inventory at 154kt which is up 10% on last week. SHFE prices are considerably weaker and the import loss reaches 1000 RMB/tonne
New Zinc Project Supply Set to Rebound
New/Expansions/Restarts ex- china annual additions, kt

Lead plays catch up
Lead’s solid fundamentals appear to have been overlooked by the fund community because of the weaker liquidity compared to sister metal Zinc. The Zinc/Lead ratio hit brief hit highs of 1.36x but has quickly turned as Lead plays catch up amid tight scrap and concentrate markets. Sure enough, all attempts for the ratio to go above 1.3x have been short-lived. The latest drawdown in LME stock saw a 3% surge in the first two days of February. Stocks are down 8% or 11kt already this year, and except for a short-term relocation of stocks in 2015, these are the lowest levels since 2010. The spreads have followed suit and tightened to a fairly extreme $20b.
As the impact of monetary flows normalises, we expect the Lead/Zinc ratio to come back to 1.26x in Q2 and 1.17 in Q3.
Nickel: SHFE speculators push too far too soon
LME Nickel briefly surpassed $14,000/mt on Thursday and Tuesday last week for the first time since mid-2015. But what goes up must come down as Friday saw prices fall 4%. We believe the prior break above $13k was driven by extreme speculative flows on SHFE. Market fundamentals do justify a higher average price, but this seemed too much too soon. Since December we have been concerned by Nickel prices outperforming stainless, and we await the ability for these costs to be passed on.
Warnings from Stainless
The Chinese stainless steel market was the perfect indicator for nickel prices through H2 2017. The uptick in SS prices following a slowdown in production led nickel’s rebound since June 2017, and when prices were overbought on the post-LME Week EV exuberance, it was SS that led the markets down. If history repeats then the nickel price still looks vulnerable so long as the SS producers are squeezed.
Other physical market indicators also dislocated from the latest speculative burst and set the path for Friday's correction. The Shanghai contract experienced a 20% jump in open interest on Jan 25th as speculators piled on positions that inflated exchange prices by a 500RMB/t premium to the physical Changjiang spot nickel price. The 1-3 month contango also widened and the NPI market quickly reversed its much milder 2% gains.
China stainless steel vs nickel prices

A tight market, but dont forget the stocks
While the speculators might have pushed too fast, the continual tightening in nickel markets is undeniable. With EV demand contributing minimal tonnages (<3%) and the battery/chemical friendly briquettes now growing to 80% of the LME stock we believe it is stainless that will drive these markets for some time. According to Metal Bulletin, the briquette premiums in Europe have risen 65% in the last 12 months, but this is eclipsed by a 2.2x surge in the full plate cathode premiums preferred for stainless steel. The ISSF have reported stainless steel output up 7% Q1-Q3 in ’17 which is following +10% in 2016. Markets are tight irrespective of the EV exuberance.
Given these strong stainless growth rates, we suspect INSG figures have been under-reporting demand (due to unreported stock draws). So 2018 deficits will likely exceed the 53kt forecast, and this is even with slower growth rates as we expect the stainless surge to tail off. While the LME stocks have drawn down a sharp 17kt year-to-date, they remain a hefty 70 days of demand. Even given stronger deficits this year it will take some time for these to be meaningful drawn down. Until then overall price appreciation will be gradual with such speculative bursts short lived.
"THINK Outside" is a collection of specially commissioned content from third-party sources, such as economic think-tanks and academic institutions, that ING deems reliable and from non-research departments within ING. ING Bank N.V. ("ING") uses these sources to expand the range of opinions you can find on the THINK website. Some of these sources are not the property of or managed by ING, and therefore ING cannot always guarantee the correctness, completeness, actuality and quality of such sources, nor the availability at any given time of the data and information provided, and ING cannot accept any liability in this respect, insofar as this is permissible pursuant to the applicable laws and regulations.
This publication does not necessarily reflect the ING house view. This publication has been prepared solely for information purposes without regard to any particular user's investment objectives, financial situation, or means. The information in the publication is not an investment recommendation and it is not investment, legal or tax advice or an offer or solicitation to purchase or sell any financial instrument. Reasonable care has been taken to ensure that this publication is not untrue or misleading when published, but ING does not represent that it is accurate or complete. ING does not accept any liability for any direct, indirect or consequential loss arising from any use of this publication. Unless otherwise stated, any views, forecasts, or estimates are solely those of the author(s), as of the date of the publication and are subject to change without notice.
The distribution of this publication may be restricted by law or regulation in different jurisdictions and persons into whose possession this publication comes should inform themselves about, and observe, such restrictions.
Copyright and database rights protection exists in this report and it may not be reproduced, distributed or published by any person for any purpose without the prior express consent of ING. All rights are reserved.
ING Bank N.V. is authorised by the Dutch Central Bank and supervised by the European Central Bank (ECB), the Dutch Central Bank (DNB) and the Dutch Authority for the Financial Markets (AFM). ING Bank N.V. is incorporated in the Netherlands (Trade Register no. 33031431 Amsterdam).