Energy transition to move power prices over the short and long-term; more volatility expected
The energy transition will increase the long term costs of the energy system and power prices could rise by 2050 as a result. But more wind and solar will push prices lower in the short term. The swing effects are highest for wind energy: a 50% increase in the share of wind power causes weekly prices to drop by -7% on average and monthly prices by -8%

Renewables are one of the many factors that determine power prices
There are many factors that determine power prices. This article analyses the impact of increasing shares of weather dependent wind and solar power on power price dynamics in some key European countries.
Scope of this study
Renewables are one of the many factors that determine power prices

The only way is up for wind and solar power
Wind and solar power have grown massively in recent years across Europe. In Ireland, 40% of power generation is expected to come from wind turbines and solar panels in 2021, compared to around 30% in Spain, Germany and the UK. Shares are considerably lower in France, Belgium and the Netherlands, but the trend here is also upwards. So far, coronavirus has had little impact on the rise of renewables.
More power from wind turbines and solar panels
Share of wind and solar power in a country's power mix, yearly generation data.

Power prices are likely to rise long-term...
Energy systems have to change dramatically in order to reach a carbon neutral economy by 2050. How energy systems will look exactly is still unclear, but the direction is clear. By 2050, energy systems will:
- depend more on intermittent sources of renewables like solar and wind energy;
- depend more on electricity because of the electrification of energy-intensive sectors;
- be able to store energy for short (batteries) and longer periods (like hydrogen and thermal storage);
- capture and store carbon emissions from fossil fuel energy sources (CCS on fossil fuel power plants);
- have a more diversified and integrated grid infrastructure for gas, power, hydrogen and CO2.
All of these changes require vast amounts of investment in an already quite efficient, though fossil-based, energy system. The costs of the energy system will rise as a result.
Many factors call for a substantial rise in long term power prices
Many factors call for a substantial rise in long-term power prices. Below are some of the long-term value drivers of power prices.

…but beware the short-term power price cannibalisation
While there are good reasons to expect higher power prices in the long term, there is compelling evidence that renewables will push power prices temporarily lower in the short term dependent on season, demand and geography, which is often referred to as price cannibalisation.
Meet the cannibals: wind turbines and solar panels
Cornwall Insight defines price cannibalisation as the depressive influence on the wholesale electricity price at times of high output from intermittent, weather-driven generation such as solar panels, onshore and offshore wind turbines.
What price cannibalisation? Defining the short term
Short term price cannibalisation can happen on different timespans as weather conditions vary from hour to hour, day to day, week to week and month to month.
Intraday price cannibalisation is a major topic for owners of solar and wind farms. Solar panels for example, produce their maximum output on sunny days during midday when solar irradiation is at its best. This can cause the intraday power price to drop to low levels during these hours of high solar generation. Owners of solar farms seek to make their earnings during these hours of ample supply, but may reap a lower power price. That power price is called the captured price: the actual power price a generator is able to capture when it is generating electricity. For example, an owner of solar panels might capture only 85% of the average daily wholesale price as he produces power only in the low cost hours.
On occasions during certain hours in a day when demand is low and generation from renewables is high, wholesale and captured power prices can even be temporarily negative, causing a penalty for generators in times of high supply (unless they opt to switch off). Subsidy schemes increasingly account for this. In the Netherlands for example, owners of solar and wind farms do not receive subsidy for the power they generate if the power price is negative for more than six hours in a day, which may add to lower captured power prices. This topic of low captured prices is also strongly related to the duck curve: the way that high solar generation at midday is impacting power generation and demand for grid operators. Generators do have the option to temporarily suspend production, or install on-site storage solutions to mitigate the impact of lower power prices.
While price cannibalisation might be largest for captured power prices on an hour by hour basis, we cannot quantify it as there is no market data available on captured prices. We also want to extend our focus from the very short term to weekly and monthly power price trends. For these reasons we investigate price cannibalisation on a weekly and monthly basis on realised baseload power prices [see note 1].
The weather determines the day-to-day importance of wind and solar in the power mix
Variation of the daily share of wind and solar power in a country's power mix, 2018-2020.

Weather conditions determine the amount of power generation from wind turbines and solar panels. On sunny and windy days they produce a lot of power, on rainy and wind-free days hardly any. The daily share of wind and solar power varies as a result; from almost zero up to over 80% in Ireland and over 60% in Germany and Spain. That's why wind and solar are called variable renewables, compared to other renewables such as hydro power and biomass that are adjustable just like coal- and gas-fired power plants. They are also called intermittent power sources as opposed to fossil fuel power plants that are available most of the time.
Renewables push power prices lower in the short-term
Our data confirms that baseload power prices [see note 1] are, on average, much lower in weeks with high power generation from wind and solar.
Negative relation between power prices and the amount of power generation from wind and solar
Link between the spot power price and the share of wind and solar power in a country's power mix, weekly averages for 2018-2020 period

Wind of change for weekly and monthly power prices
While our scatter plots are telling, they do not capture the full cannibalisation effects from wind and solar power. Other factors can play a role, too. Lower commodity prices or lower electricity demand in weeks with high wind and solar generation can also contribute to a negative correlation between power prices and renewables.
We have built a model to isolate and quantify the cannibalisation effect from the many other factors that determine power prices. We apply the model to average weekly and monthly data to capture the medium term impact of renewables on power prices.
The table below presents the overall trend across the countries examined, based on a panel data regression. This technique combines the trend over time within countries with the differences between countries to assess the overall trend for the set of countries. We discuss these general outcomes first. Later on we will discuss country specific results, too.
Impact of higher shares of wind and solar on power prices
Main results of panel data regression analyses for Germany, France, the Netherlands, Belgium, Spain, UK (1) and Italy (2) in 2018-2020 period.

Our main findings across all the countries are:
Wind turbines make a difference on a weekly and monthly basis
A 50% increase of the share of wind power in the power mix lowers power prices by 7% on a weekly basis and 8% on a monthly basis. Note that the ceteris paribus clause holds and that the results represent the overall trend across the countries.
There are two reasons for the sizable impact from wind turbines.
First, wind turbines can generate power 24/7 whereas solar panels only during the day. As a result, 1 gigawatt of offshore wind capacity produces on average 4.1 terawatt hours of electricity across the globe, four times more than 1 gigawatt of solar capacity which produces 1.0 terawatt hours of electricity.
Second, wind energy has a higher share in the generation mix of many countries. For example, wind turbines generate about five times more power compared to solar panels in the UK, four times in Spain and about three times more in Germany and France. In the Netherlands wind and solar generate an equal amount of power and Italy is the only country where solar generation is higher than wind generation (about 20%).
Solar panels matter less on a weekly and monthly basis
A 50% increase in the share of solar power causes power prices to drop by about 2% on a monthly basis, which is four times smaller than the effect of wind turbines. On a weekly basis the result is statistically insignificant so we cannot come to a conclusive answer whether or not price cannibalisation exists.
Note that we investigate power prices on a weekly and monthly basis. As stated before, the impact from solar panels is likely to be considerably higher if one considers intraday power prices variations.
So, while solar panels might be more top of mind by consumers and businesses when it comes to renewable energy, wind turbines have a bigger impact on weekly and monthly power price averages. There is truly a wind of change.
On the commodity side, gas prices have the biggest impact
On a weekly basis gas prices have the biggest impact, carbon prices on a monthly basis
A 10% increase in gas prices raises power prices by 5% on a weekly basis. On a monthly basis carbon prices matter most.
When commodity prices move in tandem, the impact on power prices is reinforced
For example, when both gas, coal and carbon prices go up by 10%, power prices go up by 11% on a weekly basis and 15% on a monthly basis.
Gas prices matter more than coal prices
In general, gas prices have a bigger impact on power prices than coal prices. On a weekly basis, we don’t find a significant impact of coal prices on power price dynamics. That is in line with the observation that in European countries gas fired power plants are often the price setting power plants in the merit order.
The law of demand holds
We find that power prices go up by about 3% if demand rises by 10%, both on a weekly and monthly basis.
The results are quite robust
- First, all signs are as expected. We find that, on average, higher shares of wind and solar lower power prices, rising commodity prices increase power prices, and a rise in power demand results in higher power prices.
- Secondly, the size of the measured effects is quite similar for weekly and monthly data, although a bit larger for monthly data.
- Third, most results are statistically highly significant and the explanatory power of our model is more than sufficient.
Geography matters: the impact of solar and wind differs per country
The seven findings represent the overall trend across the countries we examined. In practice, the characteristics of power markets vary substantially from one country to another or even within countries. In Italy for example, the day ahead market consists of six regions. The table below provides the country results and regional results for Italy.
When looking at specific power markets our main findings are:
Wind turbines have a larger impact on average weekly and monthly power prices compared to solar panels in most of the regions. In France, Germany and Spain price cannibalisation from wind turbines is largest.
For many countries we do not find a statistically significant effect from solar power on average weekly and monthly power prices at all, especially on a weekly basis. Solar does have an impact in Germany, France and the UK on a monthly basis but the impact is small compared to wind turbines. Sicily stands out as the impact from solar is large and tops wind, but it is a very small and specific power market.
Nuclear power is, like wind and solar, an energy source with almost zero marginal costs. It costs very little to produce an extra megawatt hour of power once the nuclear power plant is running. France is the country with the highest share of nuclear power (up to 75% of power generation in the yearly power mix). This has two implications.
First, maintenance or outages of nuclear power plants have a large impact on power prices. Our analyses on 2018-2020 data suggests that a 5% reduction in the share of nuclear power generation causes power prices to increase by almost 20%.
Second, with a high share of low cost nuclear power, small swings in the power supply of wind and solar have large power prices implications. For example, a 20% increase in the share of wind and solar in France has a similar impact on weekly and monthly power prices as a 50% change in Germany. In fact, a 50% change does not happen in France as the share of nuclear energy is so large.
These findings clearly show that power markets are not alike. Local circumstances must be taken into account when analysing investments or business cases in renewable energy.
Impact of higher shares of wind and solar on power prices
Results from country or regional analyses, 2018-2020

Expect more power price volatility with rising shares of wind and solar
Governments continue to push for more renewables in their power mixes. The Netherlands, for example, aims to generate about 75% of its power from renewables by 2030 compared to just under 20% now, with wind and solar providing the lion’s share. The weather will have a bigger impact on short term power prices as a result, not only in terms of the level of power prices, but also the volatility of prices. Our analyses suggest that periods with the lowest power prices coincide with periods in which the share of power generation from variable renewables is highest.
Notes:
1] The baseload power price is the price for baseload power which is the electricity demand required on a continuous basis, i.e. 24 hours a day all year round, to power continuous industrial processes, and essential services such as, hospitals, traffic lights, communication services, etc. As such, the baseload power price is a benchmark for heavy power users in manufacturing, transportation, real estate and the power sector. We analyse actual day ahead baseload prices, which is the realisation of the baseload power price in the day ahead market.
Download
Download article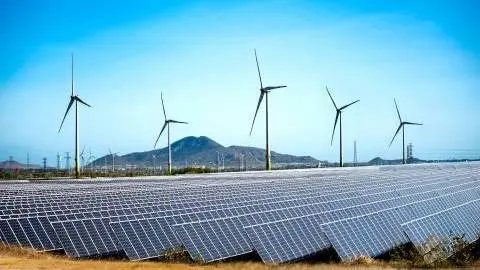
23 June 2021
Energy transition and power prices: ING’s view on long and short-term price moves This bundle contains {bundle_entries}{/bundle_entries} articles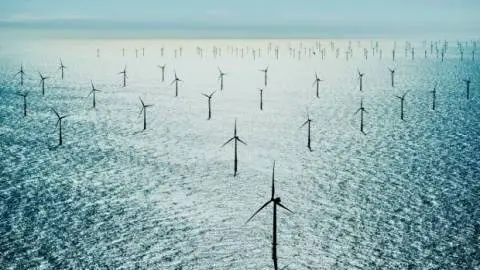
This publication has been prepared by ING solely for information purposes irrespective of a particular user's means, financial situation or investment objectives. The information does not constitute investment recommendation, and nor is it investment, legal or tax advice or an offer or solicitation to purchase or sell any financial instrument. Read more