Crude oil: Looking increasingly vulnerable
We have revised higher our oil price forecasts, however, continue to believe that the crude oil market remains vulnerable to the downside
Crude oil market update
ICE Brent traded to an intraday high of US$71.28/bbl last week, levels last seen in late 2014. Inventory withdrawals, strong OPEC compliance and a weaker USD, have all been supportive factors. Therefore we have revised our ICE Brent forecast US$5/bbl higher for each quarter through until the end of 2019. However, we still believe the market looks vulnerable, as more recent price action has demonstrated, and expect to see a further pullback.
2018 oil supply forecasts
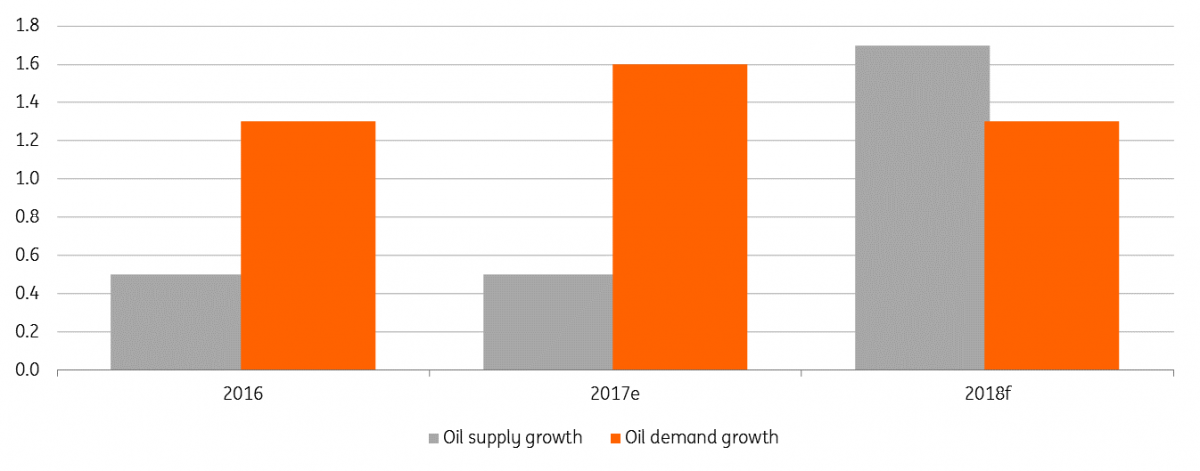
It was only a matter of time before the higher price environment saw market estimates of the supply start to edge higher. In the IEA’s monthly oil market report, the agency revised higher its non-OPEC supply estimate for 2018 from 1.6MMbbls/d to 1.7MMbbls/d. It is no surprise that this growth is driven predominantly by the US, with output expected to increase by 1.1MMbbls/d. Drilling activity in the US is picking up, with drillers adding 12 rigs so far this year, a trend which is likely to continue as long as prices remain at these attractive levels.
In the longer term, oil producers appear to be willing to increase spending, with the news that Exxon Mobil would invest US$50b in the US over the next five years, of which US$35b is for projects previously not announced. While price is a clear driver in this increased spending, Exxon has said that Trump’s tax reform also played a role. This additional investment will be focussed on increasing oil output in the US Permian region.
With the crude oil market having rallied more than 50% from its 2017 lows, it should be expected that we see a slowing in oil demand growth over 2018. The IEA estimate that demand will grow by 1.3MMbbls/d in 2018, compared to 1.6MMbbls/d in 2017. However demand surprised to the upside last year, and with the general sentiment in the global economy still positive, demand will remain an upside risk for the market for the remainder of 2018.
IEA supply & demand growth estimates (MMbbls/d- YoY)

How low can Venezuelan production go?
Venezuela has been a star performer when it comes to their compliance with the OPEC production cut deal. As part of the deal, the country agreed to cut output by 95Mbbls/d to 1.97MMbbls/d. However Venezuelan 2017 output averaged 1.93MMbbls/d (227Mbbls/d lower YoY), while production fell to a low of 1.75MMbbls/d in December 2017. Venezuela’s demise has certainly helped OPEC reach its broader target, with the group’s compliance in December increasing to 129%.
But Venezuela’s good job with cuts is certainly not out of choice. Instead, it reflects the slow death we see in the country’s oil industry. Low levels of investment, a lack of equipment, shortage of skilled workers and low prices in recent years have proved disastrous for the country. While oil prices have recovered somewhat, there is unlikely to be a material change in the trend, with little sign of political or economic change.
While the head of state-owned PDSVA expects production to recover to 2.4MMbbls/d over 2018, we, unfortunately, believe that the country will continue to see similar losses in oil output this year. This suggests an average production in the region of 1.7MMbbls/d. However, with spare capacity of around 4MMbbls/d between other OPEC countries, and with some members not too concerned about sticking to their cuts, it does seem OPEC will fill any shortfall from Venezuela moving forward.
Brent forward curve widens
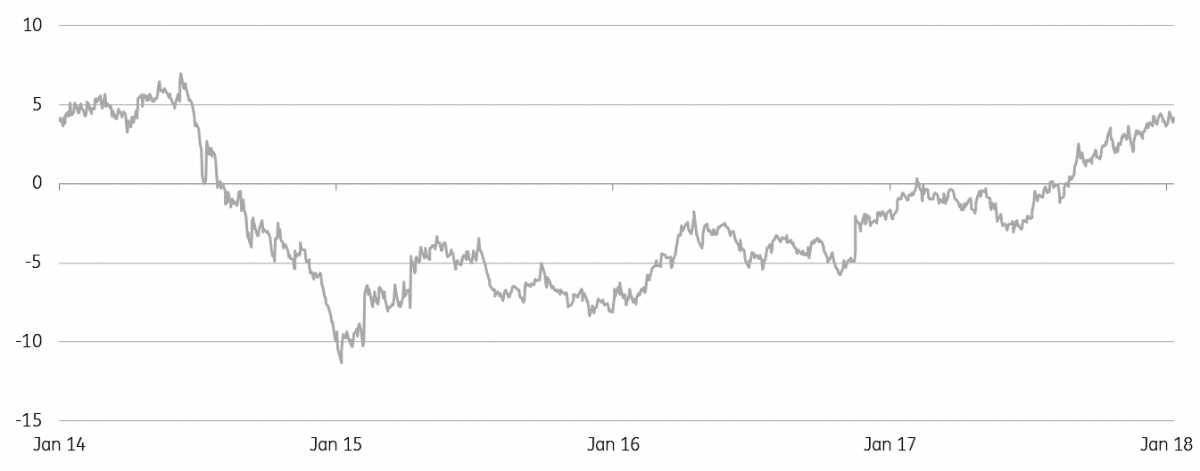
The ICE Brent forward curve says a lot about the state of the oil market, and recently with spreads widening, the curve has moved deeper into backwardation. The 12M spread has increased from US$3.60/bbl at the start of 2018 to US$4.20/bbl currently, levels last seen in July 2014. While this is a sign of supply tightness in the spot market, we believe that speculative positioning has also played a key role in the shape at the front end of the curve.
The managed money net position in ICE Brent stands at a record 584,707 lots, which is close to 20% of total market open interest. Meanwhile higher prices have also meant that producers have been happy to lock in hedges further forward along the curve, confirmed by the fact that the producer/merchant gross short stands at a record 1,577,942 lots. While we believe that speculators are overextended, attractive roll yields on offer for speculative longs suggest that they are in no rush to exit the market just yet. Narrowing spreads moving forward though could quickly change this.
ICE Brent 12 month spread (US$/bbl)

Refined products market update
Growing product inventories have meant cracks in both the US and Europe have been largely range bound. However with strong refinery throughput, particularly in the US, we would expect cracks to come under pressure moving forward.
ARA product inventories continue to recover
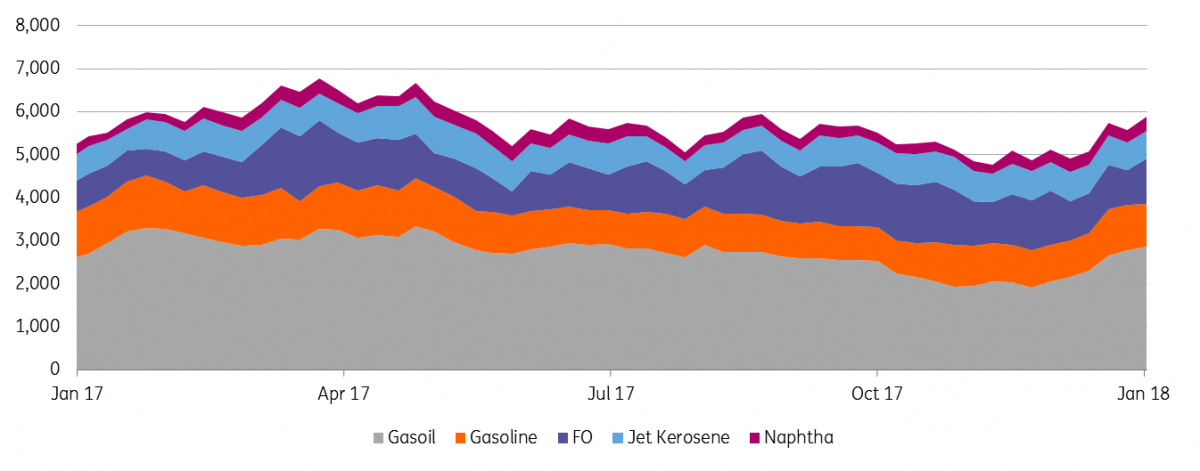
Data from PJK International shows that refined product inventories in the ARA region continue to increase, with them hitting 5.89mt for the week ending 25th January, the highest stocks have been since September 2017. Meanwhile, gasoil inventories increased to 2.86mt for the week, the highest levels since August 2017. Stronger flows appear to have added to the build, with Bloomberg ship tracking data showing that flows into Europe from the Middle East are set to hit a record 2.79mt in January, up from 2.43mt in December 2017.
Meanwhile, high water levels on the Rhine also led to the closure of sections of the river to traffic, disrupting product flows from ARA ports to inland delivery centres. However, the river reopened to traffic this week, which should see flows return to normal.
ARA refined product inventories (kt)

Get ready for stronger Chinese product exports
Strong Asian cracks and upcoming holidays in February has seen Chinese teapot refineries increase utilisation rates to 66.4%, up from around 64.8% for most of January 2018. Utilisation rates at these refineries have trended consistently higher over recent years, which has supported the increased export availability of refined products. This is also a trend which is unlikely to change, with the expectation of once again record export flows over 2018.
China National Petroleum Corporation estimates that Chinese diesel net exports could increase 47% YoY to 23.8mt, while gasoline exports could increase 23% YoY to 12.8mt. If these stronger flows are realised, expect further pressure on cracks, with this supply competing for market share regionally, but also further afield, such as in Europe.
LPG/naphtha spread weakens
Naphtha cracks in North West Europe fell to negative US$3.3/bbl, the lowest levels since June 2017, as increased LPG availability has seen petchem crackers switch to LPG. PVM data shows that LPG was trading at a discount of US$112/t to naphtha in Europe, the largest discount since August 2015. Strong LPG exports from the US and cracker maintenance in Asia has increased the availability of LPG in Europe. It is thought that Saudi Aramco could lower LPG prices further, pressuring the LPG/naphtha spread, and supporting a further switch from naphtha to LPG.
Natural gas market update
Expectations of colder weather across parts of the US has seen NYMEX Henry Hub rally to as high US$3.6/MMBtu, up more than 20% YTD. Although the market has given back some of these gains more recently. In Europe, TTF prices continue to soften, with warmer than usual weather and sufficient inventory.
Record gas inventory withdrawals in the US
It has been a strong start to the year for natural gas inventory withdrawals in the US, this should come as no surprise given the colder than usual weather that has been seen across large parts of the country. The first week into the year, and the EIA reported the largest weekly net inventory withdrawal on record- 359Bcf, then last week the another significant withdrawal of 288Bcf was reported, which matched the previous record set in January 2014. Current inventory levels stand at 2,296Bcf, 18% below the five-year average.
The cold snap has also brought speculators into the market, with the managed money net position rising from a net short of 53,408 lots at the end of 2017 to a net long of 166,634 lots on 23 January 2018, the largest position since June 2017. Looking at historic positioning, speculators could have further to run, with them holding a net long of around 246k lots back in May 2017.
European gas inventories
Across the Atlantic, the weather has not been as cold. 147TWh of natural gas was withdrawn from storage since the start of the year, slightly higher than the five year average of 139TWh over the same period. However given the higher starting point, current inventories of 545TWh are still nearly 25Twh above the five-year average, and with only two more months to go in the withdrawal season, EU gas stocks are likely to end the year above the five-year average.
Egyptian LNG imports coming to an end?
Egypt’s petroleum ministry says that the country could stop LNG imports by the 2nd half of 2018, as the country’s domestic gas output surges at new fields, including the massive Zohr field. The country previously planned to halt LNG imports in 2019. IGU data shows that with 7.3mtpa of LNG imports, Egypt’s share in global LNG trade was around 2.8% in 2016. The loss of Egyptian demand is not a positive development for gas markets, at a time when US LNG export capacity is set to come online.
Download
Download articleThis publication has been prepared by ING solely for information purposes irrespective of a particular user's means, financial situation or investment objectives. The information does not constitute investment recommendation, and nor is it investment, legal or tax advice or an offer or solicitation to purchase or sell any financial instrument. Read more
