
How much floating rate debt should you have?
We see the US as the key reference for identifying the optimal mix between fixed and floating rates. But other markets are worth looking at, as they throw up differing circumstances. The eurozone and Australia have an extreme horse-shoe efficient frontier. The UK has a linear trade-off between risk and cost, while Japan's is inversed
Recently, we published a short report that sought an optimal fixed versus float rate mix for a liability portfolio. We identified 17.5% as an optimal proportion of floating rate debt, one that managed to minimise volatility and achieve a 30bp reduction in interest rate costs relative to being 100% fixed. We also showed how further rate cost reductions could be considered by adding more floating exposure while not moving too far from the bottom of the hook of the efficient frontier.
Efficient Frontier between rate cost and volatility for the US
Employs data back to 1988 and contrasts 3mth versus 10yr SOFR (spliced to Libor)
Note: This is based on not timing the market and comparing a rolling 3-month exposure to a rolling 10yr one. In reality, the 10yr exposure would be more mark-to-market in effect.

As the global benchmark, we believe that US circumstances best represent the interest rate versus volatility trade-off over the long term. The Federal Reserve sets the global risk-free rate, and the US rates market has a dominating influence on other markets. That being said, what about those other markets? We’ve made some selections, and they all have their own stories. We find some quite stark differences but also find differing circumstances.
The eurozone efficient frontier has an extreme horseshoe profile, as does Australia
In the eurozone, some unusual circumstances occur. Being 100% fixed has come with both the highest funding costs and the highest volatility. The lower volatility for floating rate debt is unusual. It can be rationalised by the stability brought to the front end from extreme ECB policy and a pre-pandemic lost hope that the ECB would ever move away from the anchor of near-zero rates. Hence, being 100% floating resulted in the lowest average funding costs and lower volatility compared with being 100% fixed.
But diversification benefits are also clear from the efficient frontier, where a combination of 60% floating and 40% fixed resulted in the lowest volatility. At the inflection point, there is a 75bp reduction in funding costs relative to being 100% fixed (2.8%), and funding costs are only 40bp higher compared with 100% floating (1.6%).
Efficient Frontier between rate cost and volatility for the eurozone and Australia
Employs Euribor data back to 1999, and Tibor data back to 1995, and contrasts 3-month versus 10yr
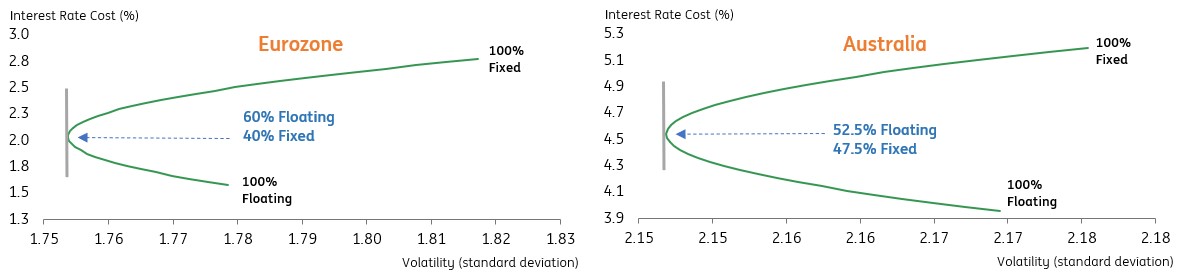
Australia is an interesting one. Its efficient frontier has a similar profile to that of the eurozone, but without the extended zero interest rate policy that helps to explain the unusual look. The overall averages for Australia are higher versus the eurozone (both the average rate cost and volatility).
Gleaning from the efficient frontier, we find that something close to a 50:50 fixed versus floating rate mix has acted to minimise volatility. By doing so, there is a 50bp reduction in interest rate costs relative to being 100% fixed (5.2%). And at that inflection point, the interest rate cost is 70bp higher than being 100% floating (3.95%). There is value to diversification.
No efficiency on the UK frontier, just a straight trade-off. In Japan, it's even inversed
Now, we move to two contrasting and unusual outcomes for differing reasons. First Japan. We see here an extreme example of the control that the Bank of Japan (BoJ) has had on keeping front-end rates on the floor (or through it) for an extended period of time. Funding costs from being 100% floating are exceptionally low. And that has come with minimal volatility. So, being 100% fixed has been higher in both funding costs and volatility. At the same time, the level of funding costs and volatility are lower than being 100% floating or fixed versus any other centre.
We also find that while there is a clear but perverse trade-off between interest rate cost and volatility, in the sense that fixed-rate debt and higher funding costs come with higher volatility. The efficient frontier is practically a line slanted the “wrong” way and identifying no efficiencies; it’s just a straight-line frontier. Factor past BoJ policy as the chief influencer here.
Efficient Frontier between rate cost and volatility for the Japan and the UK
Employs GBP swap data back to 1993, AUD bank data back to 1996 and contrasts 3-month versus 10yr
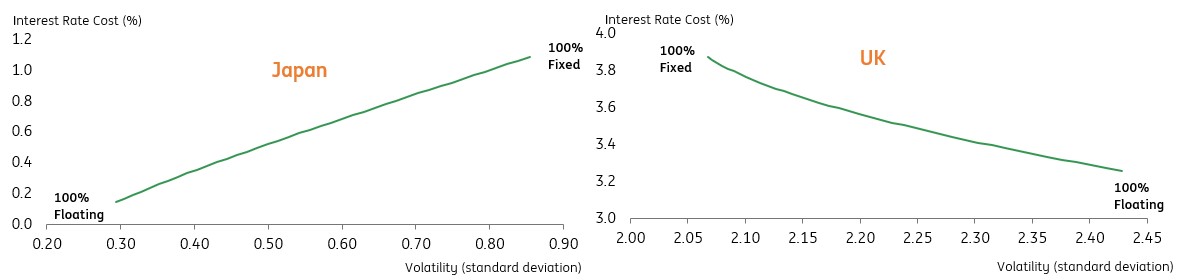
Then we move to UK circumstances. Here, we also find a straight-line frontier. It almost looks stereotypical in the sense that fixed-rate funding is more expensive and higher in volatility versus floating. However, the frontier fails to “hook” at the high rate / low volatility area and thus fails to identify an efficient inflection point.
So, we don’t get to a lower volatility outcome through diversification. We can force an inflection through the choice of data periods, but we prefer to present the full dataset and observe the results. Here, there is a trade-off between floating and fixed-rate debt, but no answer as to how much is in each bucket.
If in doubt, use the US efficient frontier as the 'go to' reference
So, where does this leave us?
While the centres identified have interesting and contrasting outcomes, we view these as mostly a function of unique circumstances. It is certainly the case for Japan, and likely for the eurozone too. It is possible they get repeated and thus reflect the future. But it is more probable, in our opinion, that the US outcome will prove a more valid reference when making choices on the fixed versus floating choice set going forward.
The UK efficient frontier is closest to the US one but misses the key hook that identifies the benefits of diversification. We'd override that by imposing the US frontier outcome on UK liability portfolios. Australia is a bit of an enigma, though. Of the markets considered, it has the greatest chance of deviating from the US-styled outcome that we favour as the central reference. But if in doubt, follow the US efficient frontier outcomes when planning for the future.
Download
Download opinion
Padhraic Garvey, CFA
Padhraic Garvey is the Regional Head of Research, Americas. He's based in New York. His brief spans both developed and emerging markets and he specialises in global rates and macro relative value. He worked for Cambridge Econometrics and ABN Amro before joining ING. He holds a Masters degree in Economics from University College Dublin and is a CFA charterholder.
Padhraic Garvey, CFA
This publication has been prepared by ING solely for information purposes irrespective of a particular user's means, financial situation or investment objectives. The information does not constitute investment recommendation, and nor is it investment, legal or tax advice or an offer or solicitation to purchase or sell any financial instrument. Read more